This discussion has been locked.
You can no longer post new replies to this discussion. If you have a question you can start a new discussion

HR screen - can anyone tell me what these numbers are?

Hi everyone,

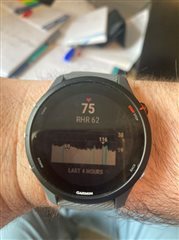
I'm hoping someone can solve this for me. I've attached a shot of my 4 hour summary of my HR. If you can forgive the horrific resting HR (I'm two months into a return to fitness after a year's absence - long story), can anyone explain the two numbers on the right hand side of the vertical scale - 19 and 38? They don't seem to have any value (or relevance).

Has anyone else seen this? Is there a way to fix it? I'm on the latest software update (12.23).

Thanks in advance,

Nick

  • I think it might be your stress level. From the manual:

    The watch has a wrist-based heart rate monitor and is also compatible with chest heart rate monitors. You can view heart rate data on the heart rate glance. If both wrist-based heart rate and chest heart rate data are available, your watch uses the chest heart rate data. There are several heart rate-related features available in the default glance loop. Your current heart rate in beats per minute (bpm). There is graph of your heart rate for the last four hours, highlighting your highest and lowest heart rate. Your current stress level. The watch measures your heart rate variability while you are inactive to estimate your stress level. A lower number indicates a lower stress level. Your current Body Battery energy level. The watch calculates your current energy reserves based on sleep, stress, and activity data. A higher number indicates a higher energy reserve. The current saturation of oxygen in your blood. Knowing your oxygen saturation can help you determine how your body is adapting to exercise and stress. NOTE: The pulse oximeter sensor is located on the back of the watch.

  • Right Still useless, but at least that's a clue as to what they're trying to do - thank you!

  • I think this is a bug.
    The stress level graph also has some numbers on the right, but those are showing the 100 and 50 % values of the orizontal lines as a reference for the graph values.
    In the hearth rate graph it should be the same, so the lower number should be something between 69 and 116, and the higher one something higher than 116 to show which hearth rate corresponds to the top and middle orizzontal lines.

    I have the same bug on my Forerunner 255.
    ( @2986359 it can not be stress values, because, in my case at least, those are higher than the ones displayed on the hearth rate graph).

    do you confirm this is a bug?

  • Same issue on the 955 as if the scale at the side is off.

  • hello,

    this is not fixed in 12.27.

  • Same for me over here in Germany. Was neither fixed with 12.23 nor with 12.27

    When I purchased the watch everything was fine - it all began with one of the updates - not sure which one it was exactly. Honestly I expected this to be recognized and fixed soon and did not put more attention to it back then. Meanwhile I'm wondering why it did not get fixed yet. Maybe not everybody is experiencing it?

    • For me values are also 38 and 19. If it really would be stress values or some other person related data, it is not very likely that everybody who mentions it hear has the exact same values then... 
  • I also have 19 and 38. These numbers are supposed to be scale numbers for the vertical axis, but there is a bug in the 4 hour screen. If you scroll down to the 7 day RHR screen, the scale numbers are correct.

  • I have 35 and 17 on my 255, but still I think this is a scale error too.