
I do not understand the data field "Elevation Graph":
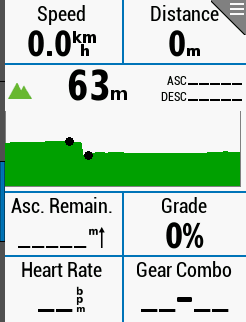
What is the meaning of the two black dots? Which section of the track is displayed?
I do not understand the data field "Elevation Graph":
What is the meaning of the two black dots? Which section of the track is displayed?

