Altitude gain in splits is wildly different from elevation graph

I had never though I would start a thread about erroneous altitude measurement. But here goes:

This morning i walked up and down the same slope 3 times. The slope has a rather constant slope of approx. 20%, and the altitude difference between top and bottom is 34 meter.

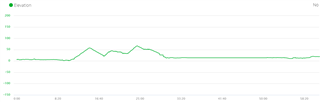
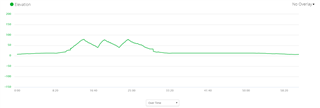
Normally, I would get a beautiful altitude graph with 3 similar peaks and valleys. This time something went wrong, and I got the following altitudes when looking at the graph:

Ascent no. N/A 1 2 3
Top: N/A 57 44 66
Bottom: 23 23 32 41

Okay, so something went wrong with the altitude measurement. Perhaps some faulty autocalibration or a problem with the ambient pressure sensor. *** happens. That was my first thought. (I can say for sure that it wasn't caused by sudden changes in ambient pressure at the same location. I was also wearing my Stryd, and the barometric altimeter in the Stryd had very stable readings all the way through these 3 ascents/descents.)

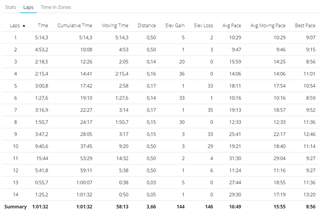
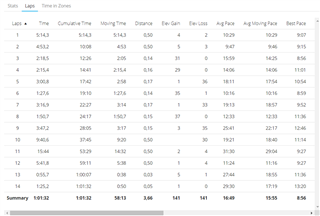
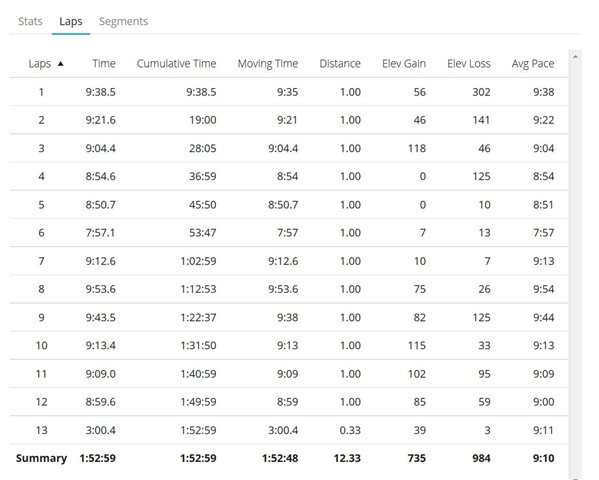
But then I started looking at the individual splits. I had pressed the lap button at the top and bottom every time. In the split table in Garmin Connect, I can see the altitude gain and loss for each split. These values were more or less correct in every split - which they shouldn't be, given the above numbers!

For example, in the second descent I only had an altitude loss of 12 meter according to the table above, which is clearly wrong. The split table in Garmin Connect says that I had an altitude loss of 35 meter, which is rather spot on.

So the split table has more or less correct elevation gains and losses*, while the elevation graph is wildly off. As if they got their data from different sources.

It is worth noting that I went quite fast on the second ascent, approx. 0,4 vertical meters/second. It is possible that the watch has a smoothing algorithm for altitude, and that I outran this algorithm, so it was still lagging behind when I started the descent afterwards. But then the split table should use unsmoothed data, which doesn't really make sense - I would rather expect the opposite, if anything. 

The session can be seen here:
https://connect.garmin.com/modern/activity/3976336597#.XV7OTEpGhbc.link

The relevant splits are no. 4-9.

The obvious next step would be to do the session once again and experiment with some pauses at top and bottom, and also make note of barometric altitude, GPS altitude, ambient pressure and barometric pressure after each split. Unfortunately, I can't do that, since the hill is in Wales, and I am back in Denmark now.

(*: The split table is not perfect either. It has some slight altitude gain on descents and some slight altitude loss on ascents. But nothing significant in comparison to the errors in the graph.) 

  • Former Member
    +1 Former Member over 5 years ago

    Can you enable the "Elev Corrections" on the right below the image of your watch. I'm curious if this only changes the Altitude graph or if it also changes the data in the table... if it only changes the altitude in the graph, then you have your answer. The table takes the data from the GPS + DEM data, while the graph shows the altimeter readings. If they both change, then I have no idea what the issue is...

  • Good call.

    But do you know for sure that the split table uses GPS+DEM? That sounds rather insane to me. The day before this session I was walking along a narrow path with an almost vertical drop of 30-50 meter a few cm to my right, and a less steep wall to my left. I would not trust DEM to give any useful altitude under those circumstances, because a very small 2D error in my GPS position or in the DEM map would cause my DEM altitude to be wildly wrong. 

    Anyway, I enabled elevation corrections. This of course made the elevation curve much more correct. But it also changed the split table a bit. Here are some before and after screenshots:

    Before:

    After:

  • Former Member
    0 Former Member over 5 years ago in reply to Former Member
    Can you enable the "Elev Corrections" on the right below the image of your watch. I'm curious if this only changes the Altitude graph or if it also changes the data in the table

    That should make it lock to the ground level, which I guess should fix the problem. You say "The day before this session I was walking along a narrow path with an almost vertical drop of 30-50 meter a few cm to my right, and a less steep wall to my left. I would not trust DEM to give any useful altitude under those circumstances, because a very small 2D error in my GPS position or in the DEM map would cause my DEM altitude to be wildly wrong. " which is right, but in this case, in a walk in a reasonably built up area (according to the map) my guess is that disabled the corrections and locking to the DEM should do it

  • Former Member
    0 Former Member over 5 years ago

    One thought mate, do you calibrate the altimeter before this?

  • I know what elevation correction does, and that it can be a workaround. I also agree that DEM would not be a problem on the specific route I linked to.

    However, my comment about DEM was towards the general problem. I maintain that using DEM for split elevation gain and loss would be (or is) crazy, because DEM is not reliable enough for that. I would trust the barometric altimeter more for that purpose, because relative elevation change over short time is exactly what a barometric altimeter does well.

  • Yes, I calibrated the altimeter. As you can see in the two graphs, my starting elevation is the same before and after elevation corrections.

  • Do you still have the activity on your watch?  If you look at the Elevation Plot there it should offer a proper representation of the recorded elevation.  The scale is hardly detailed enough to do any deep analysis but should at least give you a general idea of the slope profile and indicate high/low measurements.  That probably is what you expect to see in Connect but the back end uses GPS data as a blend and it looks like you might have experienced some cut outs that impact how the graph is displayed.

  • The altitude plot in the watch has the same error as the plot in Garmin Connect.

  • I'm stumped then!  Late for work so I'll try and add more detail tomorrow.

    Not that it'll make any more sense.

  • I use UltraTrac a lot and that makes it easy to see how the elevation graph in Garmin Connect varies wildly from the actual splits.  Somehow connect validates that it has GPS coordinates as it renders the graph and so the resulting profile is a series of steps and it ignores the raw altimeter data.  This does NOT represent the actual course profile.

    That would look something like this:

    The actual split data follows:

    The Elevation Plot on my watch would be a representation of the raw data and so certainly would be a visual of the actual climbs/descents.  Connect just 'blends' GPS points so that it flatlines points between GPS silence.  I thought that you might be experiencing a similar behavior since it looks like you have a flatline section (after the slope series you're questioning) but if you're reporting that the plot on the watch also looks wonky then I'm no help and my theory is irrelevant.  I'll have to stew on this a bit more!