fresh public FIT files for decoder testing/benchmark from DC Rainmaker Enduro review

Always appreciate DC Rainmaker making his FIT files public, he's posted a really fresh set today attached to his Enduro review

(if anyone knows of other public FIT sources let me know, particularly interested in any elite ultra/triathlon races)

Various devices and accessories in each set:

https://dcranalyzer-qxyvqnghga-uc.a.run.app/api/v1/set/09792304-fe78-4014-4fb1-76fb9ebe0680/files/set.zip

https://dcranalyzer-qxyvqnghga-uc.a.run.app/api/v1/set/73860443-57d2-457a-5375-4a782cb727ff/files/set.zip

https://dcranalyzer-qxyvqnghga-uc.a.run.app/api/v1/set/11e73e26-f1cf-45c9-5b80-1d3ebb05f86a/files/set.zip

https://dcranalyzer-qxyvqnghga-uc.a.run.app/api/v1/set/43062fa7-d0f8-4b98-69cd-c318e94993dc/files/set.zip

https://dcranalyzer-qxyvqnghga-uc.a.run.app/api/v1/set/d807bb6a-ee1c-41b4-676d-7192ed9edfc0/files/set.zip (older fenix 6x/pro/solar review from 2019)

his analyzer is pretty good too, this one has the Enduro+HRMPRO

https://analyze.dcrainmaker.com/#/public/73860443-57d2-457a-5375-4a782cb727ff

this one has the Enduro on a "forest run" compared to the 945 with HRMPRO

https://analyze.dcrainmaker.com/#/public/09792304-fe78-4014-4fb1-76fb9ebe0680

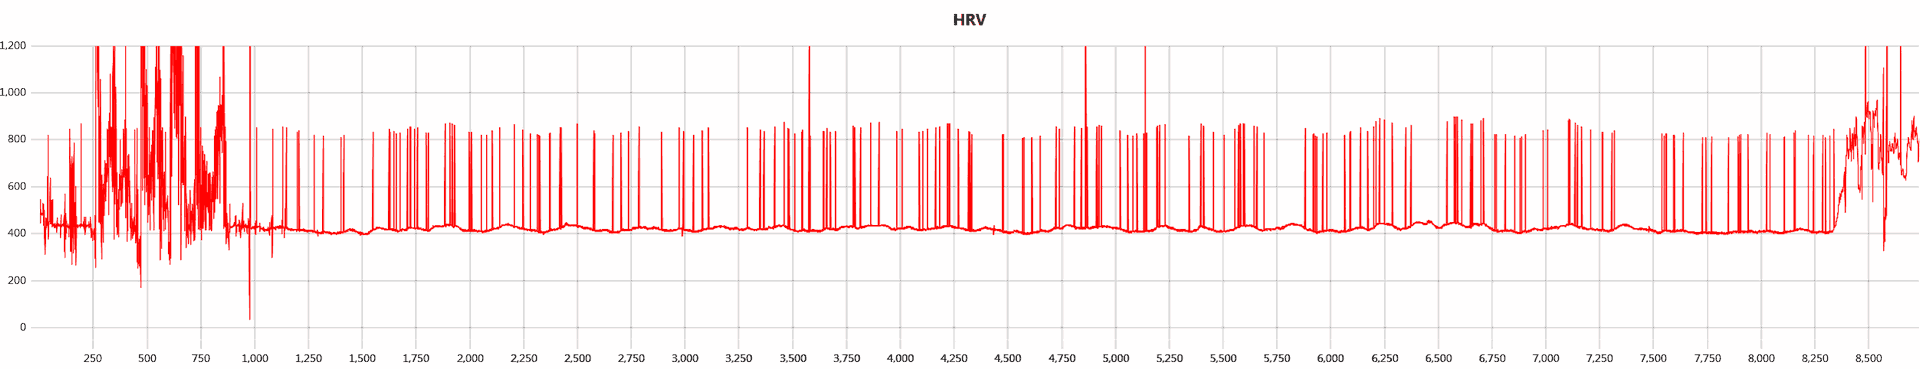
looks like the Enduro optical is spot on with just a couple of spikes compare to the HRM strap

Bring on the 955 and Fenix7, can't wait to see what's in CIQ4 and the newest FIT files.

  • That analyser is pretty cool. I'd like one for the 3D sensors I'm dealing with... Is "FIT-o-holic" a thing? Because slowly becoming one, devouring every FIT-file I can get my grubby hands on. Thanks for the links!

  • it's amazing people are already producing tools with that javascript parser

    HRE seems similar to TRIMP (and garmin/firstbeat's training load which is metmax based)

    https://fellrnr.com/wiki/TRIMP

    HRE would be limited in that you cannot compare heartbeats for two different athletes because heart pump volume can vary widely depending on body size and training - in fact you could not compare the same athlete at two different ages, TRIMP "normalizes" that somewhat

    I am not sure if my guessing is correct but after studying global message id 140  for days and weeks even, I started to believe 140:5 is what I call "met-capacity" and 140:6 is "met-work" for the activity and you can get something like the daily load by  metwork / metcapacity, then the watch keeps a rolling average for 7 days

    What's also neat is message id 78 which is HRV data when using a HRM strap, I threw the values into uplot to see what they look like in a graph, this is the timing between heartbeats, not sure what is up with the start and end unless maybe the strap was not working right

  • ΗRΕ = HR*pace is derived for runners and is of clear sence = number of heart rate beats per kilometer. Example of the analysis is given here https://drive.google.com/file/d/17wK0y5p7rYlMRBogpZ9yicdnV191E1qx/view?usp=sharing  you can find their graphs. The metrics like TRIMP are useful, but these are just empiric correlatuions, and their meaning is not compltely clear for me

  • producing tools with that javascript parser

    For fitplotter, I used parser published by Dimitrios Kanellopoulos while ago in github. Actulally, the friend of mine who used Suunto, asked me about the utility, http://maraforum-2.ru/viewtopic.php?f=6&t=3477 (in Russion)

  • I did, looks nice! But If you meant for the 3d sensor data, this exists in separate fit messages (164/gyroscope_data, 165/accelerometer_data, 208/magnetometer_data) and must be augmented with calibration data (167/three_d_sensor_calibration) on top. I don't really make use of Record/20 right now. For GPS on the VIRB it's 160/gps_metadata, for example.

  • Thank you for testing.  Now online fitplotter version is ready 

    https://karaul.github.io/fitplotter/index.html 

    As to fit messages, the structure of js fit-parser is clear, so new definitions can be added. Right now, I do not know whether 164/gyroscope_data, 165/accelerometer_data, 208/magnetometer_data, etc messahes are taken into the fit-parser outcome - must look in the code. The fitplotter uses js fit parser outcome as it is, and gives a droplist for all messages to plot the supplied data. As runner, I am interested in few of them, i.e. heart_rate, cadence, etc;  as well there are data what I have no idea about 

  • Yep, that's the one I tried. Slight smile

    As for data and parsing, I guess I do it in two steps. The first and most important step to me is to have a parser that's as generalised as possible that outputs non-interpreted data (i.e. longitude will just be a sint32 in semicircles still. That way I can pick and choose for the second step, processing. Trying to create a fit parsing library in Rust out of the parse code for a tool I built, but it's not quite there yet.

    Of course, in the processing step I still need to re-shape into more specific data structures, similar to what you seem to suggest for the js parser.

    FIT-files come in so many varieties. Specific messages may contain a set of fields for one device that another does not log. 160/gps_metadata has only two fields for the watch data I've looked at - if it's even there in the first place - while the VIRB logs 10 known fields and 5 unkown for that message type.

  •  as possible that outputs non-interpreted data (i.e. longitude will just be a sint32 in semicircles still. 

    it's easy. file src/bf-backfit.js, line 730 - just change there the const 

    scConst: 180 / Math.pow(2, 31) 

    https://github.com/karaul/fitplotter/blob/51e6b5cb2fa767338976493eeab2485bd87d46d5/src/bf-backfit.js

    (other mentioned below files are in the same src/ location )

    I have checked quickly the parser, the loop starting at Line 115 src/bf-fit-parser.js is trasparent, and messages are defined in src/bf-fit.js e.g. there is at line 933 - 164/ 'gyroscope_data',  so the above loop treats messages in the abstract way

    If you share an example of a fit file to analyse and specify what do you want to have a plot  (which parameters as a function of timestamp, etc ), I can try

  • Sorry I was unclear. All conversions are working fine (including calibrating 3d sensor values hopefully). I just meant that my first step intentionally outputs something raw-is so that in the next step I can always predict the input data structure.

    But yep, it's the abstract interpretation I mean.

    I posted a small virb fit file here.

    To see what I mean you can try the tool I linked (I have some upcoming bug-fixes + changes not yet added to the linked version):

    "geoelan check -f FITFILE.fit"

    to see an overview of what's in the file.

    Then

    "geoelan check -f FITFILE.fit -g 20" to print all 20/Record data for example.