Help to interpret Accelerometer data...

I'm wondering what really accelerometer data, more specifically what means the x, y & z values...

Is it speed of movement along the axes values ? or acceleration values ? Positional values measuring orientation of the watch with respect to gravity vector ?

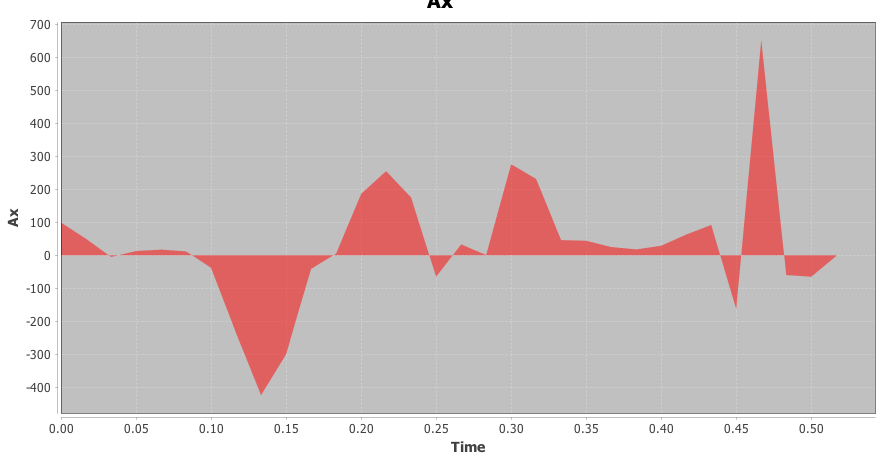
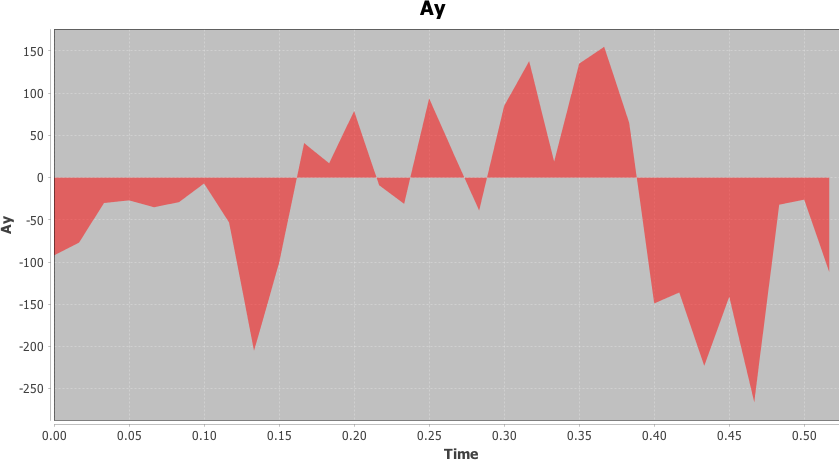
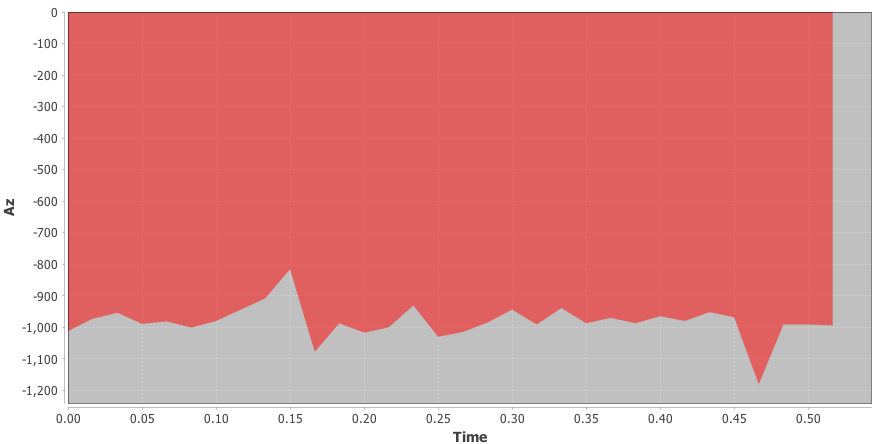
I have tried to record x, y z at regular interval when doing some basic movements but I don't understand what I get with respect to my movements...

Other poitns are strange. While I have positive and negative values for x & y, the z value is always negative (around -1000)

I join3 picture of the accelerometer values during a 32s activity doing movement un different directions with my arm...

If someone can help me or orient me with a clear definition of the values returned by the accelerometer community.garmin.com/.../1310283.png community.garmin.com/.../1310284.png community.garmin.com/.../1310285.png
  • Exactly, since it is the normalization, it will only deviate from the 1 G reading when experiencing translational acceleration. ... If you care just about total motion, then this pre-computed norm makes things much easier.


    Not sure how... Let's say that I want measure some "quantity of motion" (I don't care about a specific movement...). How will you define it ? you just at regular interval compute the difference between samples of "POWER" (since the raw value of power is meaningless as for the actual motion) ?


    My question may look stupid, maybe I lack basic knowledge about accelerometer (clearly the garmin docs are of no help)...

  • Not sure how... Let's say that I want measure some "quantity of motion" (I don't care about a specific movement...). How will you define it ?

    Before going further, is there some specific goal you are hoping to achieve with this data? It might be easier for us to provide a potential solution if you have something specific you are trying to work out with this data.

    It might also help if you were to clarify for me your use of the words "measure some quantity of motion". By measure, do you mean to simply log out the acceleration measurements? Or are you asking about the application of some layer of processing to the data to achieve a new measurement? As this applies to "quantity of motion", you have access to acceleration values as measured at 25 Hz, which themselves are discrete time quantities describing device motion. If instead "quantity of motion" refers to a number of specific movements, then how that is implemented would vary depending on the nature of the movement and we might be able to help you work out an effective solution. Are either of those interpretations of what you are asking correct?

    If you have not already done so, I might suggest looking at the PitchCounter sample provided with the SDK. It would serve as an example as to how to detect motion similar to that of pitching a baseball.
  • Or are you asking about the application of some layer of processing to the data to achieve a new measurement? As this applies to "quantity of motion", you have access to acceleration values as measured at 25 Hz, which themselves are discrete time quantities describing device motion. .

    that's it. I have seen the PitchCounter sample app (with the callback been called each second and allowing access to the accel data sampled at 25Hz).
    What I mean by quantity of motion : I want at regular interval (say 1s) to compute some kind of sum of all the movement during the interval. I want the sum to be 0 if the watch didn't move at all (say it I leave it on a table) and the sum to increase with increasing movement....

    Thus I can do like in the pitchcounter app with a period os 1s and a sampling rate of 25Hz.... and then how do I compute my "sum" ? I can't just sum up the power since a non moving watch will give a 1G value...

    Just an idea : can i just sum the 25 value of abs(power-1) ?
  • I want at regular interval (say 1s) to compute some kind of sum of all the movement during the interval. I want the sum to be 0 if the watch didn't move at all (say it I leave it on a table) and the sum to increase with increasing movement.... Just an idea : can i just sum the 25 value of abs(power-1) ?

    Sure, abs( 1000 - power) would be positive whenever acceleration along any axis is non zero. Even during periods of no movement though it will probably still have a small positive value if only due to accelerometer noise. Wouldn't be too difficult to threshold that noise out.

    and then how do I compute my "sum"?
    You could sum up the results of the abs() for each element in the given array, or you could average them out over some period of time and sum the averages as a rolling low pass filter. Would depend on the type of motion you're trying to optimize for, assuming you have something specific in mind.
  • Hi, I'm also working on a little project involving accelerometer data. I've already managed to create an app, which does the logging part. I would like to create an application where you select the weight you are lifting and then do 3 reps with that weight and you get your reached watt values as result.

    But there's also some kind of confusion with the Z-axis values. I would like to explain what I'm doing, maybe someone could point out, where I've gone wrong:

    So I log data for 6 Seconds, where I did 3 reps of shoulderpressing. So this means, one value in milli-G every 0,04 seconds, 150 in total. I've converted the fit file to excel and tried to get Velocity and space values by converting milliG to m/s² and then integrate them using the trapezoid law once for the velocity and twice for space. but the data I get don't make any sense. I think because acceleration does not give any information about directions.

    Are there any books for this kind of IMUs motion detection algorythms? Or any further documentation, i've gone through the pitch counter app, but I don't understand the "if" statements and how exactly a throw is identified.

  • But there's also some kind of confusion with the Z-axis values.


    I think because acceleration does not give any information about directions.


    I'm not sure I get your intentions correctly, but I think your mistake is that you take only the Z axis into account. This would work in a scenario when the watch is flat against the surface of the earth, i.e. the watchface is perpendicular to the line going down into the gravity center of the Earth. This is not the general case. The Z axis acceleration gives you a measurement along the Z axis of the sensor and not the Z axis of your point of reference.
  • I thought Z-axis only would be enough. When doing a proper Bench press or shoulder press you move the bar away from the gravity center. And there's no need 4 a reference point when done properly. Lets asume:

    lying on a bench with the bar on your chest. -1000 mG on the Z-axis (Zero point of reference)
    accelerate upward till the finishing position: >-1000 mG on the Z-axis (integrating values twice should result in velocity and in space)
    Rest in finishing position: -1000 mG on the Z-axis
    accelerate downward till bar on chest:
    Rest with bar on chest: -1000 mG on the Z-axis

    and so on...

    But as you mentioned this would only work if the watch would move exactly away from the gc of earth with the z axis of the sensor beeing exactly arranged to that line. But as I'm having the watch in my wrist with the z-axis of the sensor pointing to left or right of the line to earths gravity center. Z-axis alone would not do.

    But how exactly are x,yz axis arranged?

    Is Z-Axis always from Watchface to HR-Sensor? And X/Y?
  • Former Member
    Former Member over 6 years ago
    +X axis extends from 3 o'clock on the watch face, -X from 9 o'clock
    +Y axis extends from 12 o'clock on the watch face, -Y from 6 o'clock
    +Z extends from the face, -Z from the back.

    When bench pressing, I would expect -1000 mG on the X axis, not the Z. (left wrist... +1000 mG on the right)
  • This really helps me. Thank you so much! Maybe you should make this thread sticky.
  • Could someone please clarify how to get these visualization graphs from the first post of this thread? Is it just custom fitField with corresponding data displayed in Monkeyraph or there is some out of the box solution to visualiza accelerometer (or even custom sensor) data?