Compress an Array to a smaller one for drawing graphs

Without wanting to hijack the neighboring thread on the topic of Array.add(), this topic brings me right to my current brain teaser:

I have a data field that shows the rolling average graph for a certain period of time. A user has asked me not to make the graph a rolling average, but rather to show the complete activity. Problem: the duration of which is of course unknown. At first, I thought I could solve this with array.add(), but after studying the neighboring thread, I now want to do it this way:

Let‘s assume:
-it‘s about elevation
-to keep it simple: at the beginning - each second a new value
-the width of the graph is 240 pixel

At the beginning, I fill the graph from right to left. After 240 seconds, the graph is complete. I use an array with 240 elements for this.

Then a new value is to be added at the right edge. Now the previous 240 values at the left must be reduced to 239 and the new value becomes the [0] value. So I have to average/edit 240 values in such a way that the original 240-wide graph is compressed to a width of 239.

And I have to do this over and over again so that the elevation graph always show the entire activity. However, for the new value[0] at the right edge, an increasingly larger average elevation value must be formed over time, because each pixel of the graph represents a larger time span over time. However, this is easy to accomplish and not the problem.

My problem is: How can I turn 240 values into 239?
I'm racking my brains, but I can't find a solution for how to implement this.

Or is there a completely other way to handle this?

  • My problem is: How can I turn 240 values into 239?

    The answer was in the neighboring thread: use a fixed-size circular queue which can be implemented via a fixed-size array.

    This will be the most efficient solution, both memory and CPU-wise.

  • …but it should be no rolling exchange of the elements, where one element is swapped with the neighbour element, and the last element gets lost.

    Here 240 elements should be „pressed“ into 239 elemnts, without losing the last element.

    If one imagine a growing array ( .add() ) for the ongoing activity, at some point there maybe are let‘s say 320 elements. This 320 elements are to be shown in a graph with 240 pixel. 

    A special case would be if there are at some growing time 480 elements - then one could build the average of neighbour elements to get 240.

  • …but it should be no rolling exchange of the elements, where one element is swapped with the neighbour element, and the last element gets lost.

    Here 240 elements should be „pressed“ into 239 elemnts, without losing the last element.

    Sorry I misunderstood.

    It seems that you want to:

    - store all the data (let's say you have n elements)

    - display all the data such that elements 0..n-1 are displayed across 239 pixels but element is displayed in the final pixel

    First of all, I don't think that makes much sense visually. Wouldn't it make more sense to to compress all n elements into 240 pixels so that all the data points are treated equally? If the user wants to have the "exact" latest value, you could just display that as a number on top of the chart (similar to Garmin's HR chart)

    What I would do is subdivide the data into 240 equal buckets, and apply the algorithm of your choice to select a representative point from each bucket. It could be the average, min or max. Ofc no matter what you pick, users will be unhappy. e.g. users have been complaining for years that the garmin all day hr graph doesn't show the max HR value from an activity, and it's because the all day hr graph has a much lower resolution.

    If you want to have your cake and eat it too, you could plot the max, min, *and* average value for each bucket. You'd probably still want to use the average value to draw the actual line segments, but at least the user would be able to see a bit more detail (although it might be confusing)

  • Ofc it's not as simple as that. When your bucket size is fractional [e.g. 241 data points for 240 pixels or 240 points for 239 pixels as in your example], then you have to figure out a way to assign "fractional" data points to each bucket.

    Let's use my example of cramming 241 data points into 240 pixels.

    Each bucket [pixel] will be 241 data points / 240 pixels wide which roughly equals 1.0042. Every 1 pixel represents 1.0042 points of data

    You could use an algorithm which weights data points which belong to a bucket based on the size of the bucket they belong to.

    e.g.

    For a 1.0042 -sized bucket:

    - the first pixel will be the weighted average of your first 2 data points: [data[0] * 1 + data[1] * 0.0042] / 1.0042

    - the 2nd pixel will be: [data[1] * [1 - 0.0042] + data[2] * [0.0042 * 2]] / 1.0042

    - And so on.

    This becomes clearer if you have an integral sized bucket - e.g. 480 data points and 240 pixels.

    - first pixel is [data[0] + data[1]] / 2

    - second pixel is [data[1] + data[2]] / 2

    - etc

    Basically you slide your "window" of size num data points / num pixels over all the data and take the weighted average. Like I said, you can also take the min / max as well. Even if you don't plot all the min/maxes for each pixel, you could plot the global min and global max [and/or indicate them with numbers on the graph]

    EDIT: this is a bad algorithm, don't use it. Use standard linear interpolation instead

    forums.garmin.com/.../1960231

  • Thanks,  , yes, now we are speaking of the same issue!

    Your approach is the approach I had at the beginning. Let‘s say…..

    Ahhh, I see you have sent a new post!

  • Ofc it's not as simple as that. When your bucket size is fractional [e.g. 241 data points for 240 pixels or 240 points for 239 pixels as in your example], then you have to figure out a way to assign "fractional" data points to each bucket.

    That‘s exactly my problem to solve.

    Thank you for your posting. I will study it and will come back to let you know wether I have understood your example of an algorithm Grinning

  • Try this:

    https://pastebin.com/k1cJE9P5

    EDIT: this code has a bug, but even if it's fixed, it's a bad algorithm, don't use it. Use standard linear interpolation instead

    forums.garmin.com/.../1960231

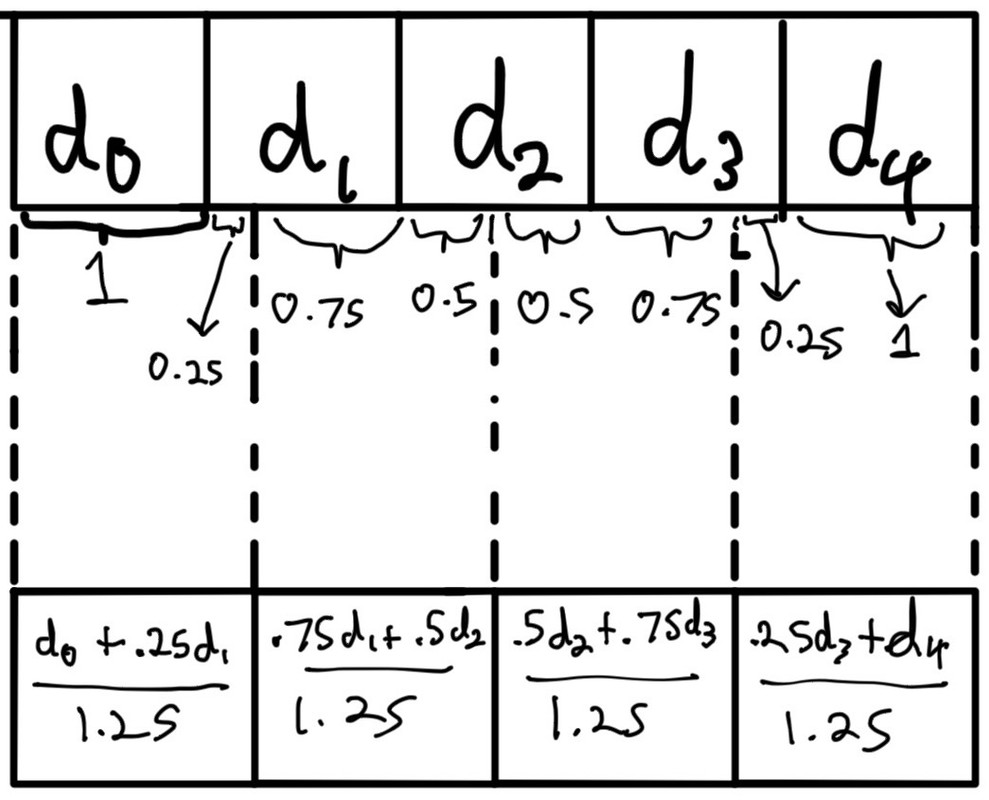
  • For example, say you want to cram 5 bytes of data into a 4 pixel graph. Your bucket size would be 5 / 4 = 1.25 and the algo would look like this:

    (The original data is at the top, and the new data is at the bottom)

    Sorry for the bad drawing haha

  • btw sorry to nitpick, but this question isn't really about dynamic array sizes at all. it's about taking a large data set and representing it at a lower resolution than the original data. Even if you had an infinite amount of RAM, you'd still only have 240 pixels of width on the display to render the graph.

  • Also, I think you want to keep the original data around, so you will always apply the algorithm to the original data. (At least keep as much of it as possible. Maybe at some point if you run into a memory limit, you can cut the data set in half or something, by averaging every 2 data points.)

    If you just keep reapplying this algorithm over and over to its own output (which seemed to be your intent), the data will just get worse and worse.

    It's like how people share screenshots of screenshots of screenshots of memes (or the same thing with repeated screen recordings), and the final result is just a blurry mess.