Peak mem difference in Simulator with loaded FIT playable file vs no load?

In have noticed in 4.1.6 that my data field App have 256 bytes less free memory when I load and playback a FIT file vs if I do not load a FIT file. I know its 256 bytes exactly of difference since I checked with:

System.println(System.getSystemStats().freeMemory);

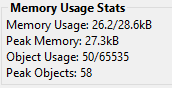
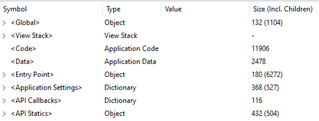
This difference has not been there in the past. And there should be no dynamic difference in my data field App. So, I analyzed it using CTRL+M and got, when not loading a FIT file but still pressed the start btn:

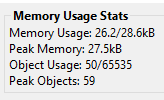
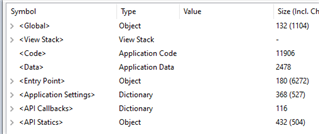
If I play back a FIT file I get:

BUT - the stack is exactly the same:

And, I have peak memory detection enabled and shown.

huh?

  • LOL, the TOTAL memory is "too close" on old devices. I mean 16k? That should be the margin we keep (don't use) for these kind of cases, not the total...

  • I am for sure walking a thin line Scream

    Which is also why I need to know if adding the 256 bytes in the sim was intentional (for some reason) or not by Garmin. 

    Still, I have not seen any crashes in the field for my Apps due to "out of memory". And, in general I take care testing in with worst case settings (such as enabling saving to FIT) and I do everything I can to avoid dynamic loads once running has begun, e.g. ignore new settings, etc.

    And, yes, I do for sure use the new -O 3 build argument - love it Grinning  I in fact use -O 3z

    The user guide says z = Code Space Optimizations, so I assume that is the setting I should be using when living on the edge!

  • There was a big change in the VM and memory starting with CIQ 2 devices.  On a CIQ 1 data field, 16k meant 16k for the app. and it was constant.

    Starting with CIQ 2, memory available for an app is actually about 4k less that the listed max.  So while data fields can be listed at 32k, the max is really 28k.  And while rare there have been a few times that the "4k" has changed a bit due to bug fixes, etc.