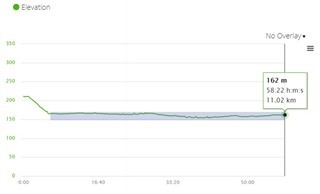
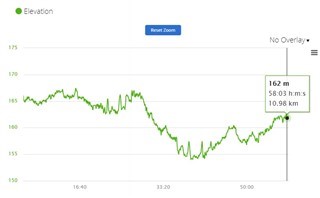
Hello! I'm a big fan of the Garmin Connect website and use it frequently. It's been great for tracking and planning future runs!
The only thing for me that might make it that much better is the ability to adjust the scale on the graphs that show elevation or at least be able to zoom into a certain range. As an example, my last run had elevations between 9m and 35m, but the scale was set to -100 and +100 making the visual representation hard to see. If I could cut off -100 to 0 and 50 to +100, then I could get a better visual representation of my elevation shifts.
Thanks so much for listening!


