You can no longer post new replies to this discussion. If you have a question you can start a new discussion
Garmin Connect Chart Scaling
Former Member
It would be extremely nice to be able to configure the y-scale on charts for any given workout. I have an activity where I gained ~100ft elevation and lost about the same, yet it looks like a straight line because it is scaled 0-1200ft.
It can't hurt your cause to ask. Better not imagine that your voice or 'vote' carries any weight in actual decision-making on the matter, though, lest you feel unduly aggrieved or outraged for being seemingly ignored.
Oh, by the way, the official way to make a request directly to Garmin is here: http://www8.garmin.com/contactUs/ideas/ (as opposed to raising it for discussion where others can see you've asked).
Oh, by the way, the official way to make a request directly to Garmin is here:
Well, I've done that several times during the past years, without any interest.
My last run varied between 12 - 49 meters above sea level. The scaling is -100 - 100. Completely useless, it's basically a flat line. It's a 5 minute fix, not rocket science.
The Garmin Connect app on my phone properly graphs the altitude between -1 and 62, which displays a much more informative and nicer looking graph.
Please do submit requests to Garmin so they fix this instead of giving us silly badges (which by the way also is wrong, I got a badge for riding "50 mil" (a "mil" is a Swedish unit for 10 km) by riding 50 miles... lost in translation, eh?)
how many years do we have to wait to get this feature?
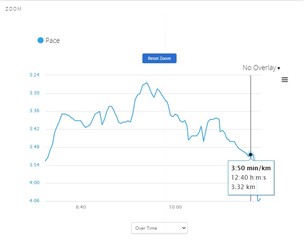
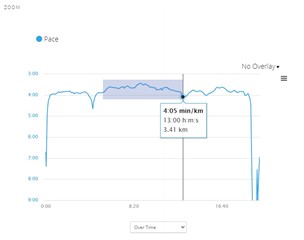
You do not need to wait at all. With local overrides you can turn on the X and Y axis re-scaling of most graphs in Garmin Connect Web, by selecting a section of the graph.
Have a look at the example below, showing the re-scaling of a small section of the pace graph:


 »»
»»