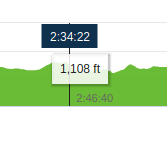
 On the page that shows all 4 graphs with the map of the run, we can move the cursor to different X-axis positions. When we do, for each graph, a box shows the Y-axis value (elevation, pace, heart rate…
For sure there is the option to set range for Y-axis. So garmin could turn it on, but they won't.
I enabled the Y-axis adjustment through the GCOverrides (local overrdies of the Garmin…


