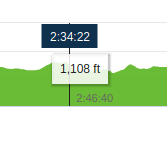
 On the page that shows all 4 graphs with the map of the run, we can move the cursor to different X-axis positions. When we do, for each graph, a box shows the Y-axis value (elevation, pace, heart rate…
For sure there is the option to set range for Y-axis. So garmin could turn it on, but they won't.
I enabled the Y-axis adjustment through the GCOverrides (local overrdies of the Garmin…
Please move the Y value box to the bottom of the graph. It annoying when it covers part of the top of the graph.
I do not think they can do it easily. First of all it is uncertain whether it is possible with the Highcharts graphical library that they are using. Additionally, the SVG object ends at the lower edge of the graph, and the info boxes cannot be displayed out of the SVG object. I recommend opening the full-size version of the graph by clicking the double-arrow symbol in the upper right corner of the graph - it is big enough and the info boxes won't annoy you.
I agree, these boxes blocking chart content is really annoying. Don't know if Garmin engineers ever tested what they have designed.
A different subject but related to charts: The y-axis of the charts cannot be set manually. Most of the time, for example with elevation, the scale is too large. And there's no way to zoom in the range you are interested in. The chart zoom function only works on the x-axis.
Does anyone know if there's a fix for it (except of exporting the chart to other formats and doing the cumbersome work there)?
I have asked Garmin to add this feature some years ago. But never got any feedback nor have seen a fix.
They didn't designed charts, as already written above, garmin just use the Highcharts. Customizable charts library, you can check demo on that developers website to see all options and what's possible to set. For sure there is the option to set range for Y-axis. So garmin could turn it on, but they won't.
For now I just check times in text splits table. It's easier to see pace this way, then on graph with wrong scale.
If export, then better to export whole activity as GPX file, then find software to display it with graphs.
For sure there is the option to set range for Y-axis. So garmin could turn it on, but they won't.
I enabled the Y-axis adjustment through the GCOverrides (local overrdies of the Garmin Connect website). Currently it is in the experimental stage, so am not quite sure whether it would work for everyone, but on my machine it works just fine and I can now adjust also the scale of the Y-axis.