This discussion has been locked.
You can no longer post new replies to this discussion. If you have a question you can start a new discussion

New track colouring - faster / slower - compared to what?

What is compared to what to get whether its slower or faster?

  • Compared to the average for that activity, I guess.

  • Nah its not, that was my first thought too.

    Thinking now its a gradient from absolute max to absolute min.

  • Would really be nice to have any kind of explanation Disappointed

  • Would really be nice to have any kind of explanation

    It does really need any - it is clear from the legend.The deepest blue from the left edge of the scale is logically used for the slowest part for your track, and oppositely the most red from the right edge is used for the fastest pace during your activity. No need for any lenghty explanation, the legend tells it all. Perhaps they could have just used the words slowest/fastest instead of slower/faster, but it is comprehensible in this way too.

  • I think you're correct, the coloring is very understandable.  Rather, the primary question was what is the fast or slower in reference to.  I've read other posts saying that it's the current activity (as you indicated) and I've also read people disagreeing with that idea.  For example, it's possible that the faster/slower is in reference to your last several activities, your fastest activity, or even activities done by others in the same area.  So this was just a request to Garmin to make it more clear what the baseline for the difference shown is.

  • It is, of course, always the min/max of the current actvity. It cannot be anything else. If it were anything general, not based on the current activity, the range would have to be very large to match all possibilities, and in the result most activities would be monochrome.

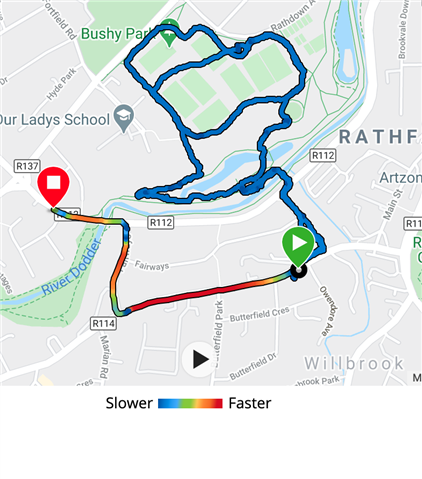
  • With min (blue) / max (red) is clear enough. What about green color? It is average speed/pace of the activity or average between min and max or 0 and max?

    Example:

    1. Min speed: 10
    2. Max speed: 50
    3. Average of activity: 20
    4. Average between min and max: 30
    5. Average between 0 and max: 25

    Green is: 20, 25 or 30?

  • What about green color?

    Practically certainly the scale is linear from the minimum to the maximum. So, since the green color is somewhere between 30-50% from the slow side, it corresponds to 30-50% of the difference slowest pace - fastest pace.

  • BTW, you can very simply see the exact value corresponding to each color, when you move the tracking point on the map to the color you are interested in, by moving with the mouse cursor over the pace graph. You then see the exact pace in the mouseover tooltip.

  • So I can't be sure that green is my real average speed/pace?