This discussion has been locked.
You can no longer post new replies to this discussion. If you have a question you can start a new discussion

Graph y-axis scaling makes most graphs flat!

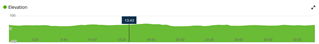
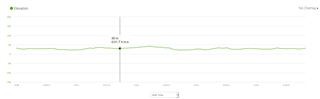
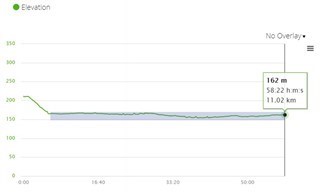
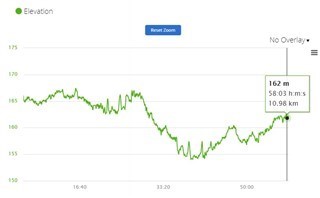
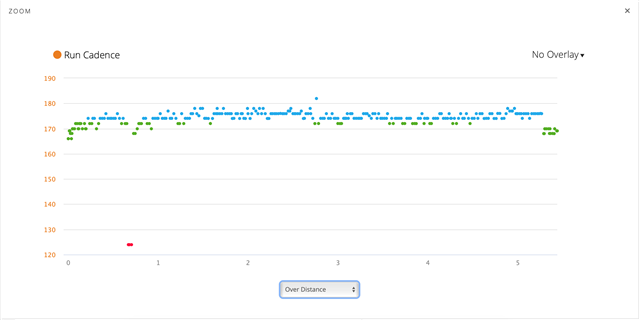
Why is the graph y-scale scaling still making some curves almost flat? This has been reported multiple times over atleast 8 years. Atleast provide a way to manually set min/max for y-axis.

For example, my last run has elevation between 21 and 42 meters, scale is -100 to +100 meters in "overview" and -150 to 200 meter when graph is enlarged.. see attached pictures. This has to be one of the most basic things in anything related to graphs!

  • Fortunately, it is not difficult at all to turn on the Y-axis scaling locally. I use it all the time. Have a look at the thread GCOverrides to find out how you can use it too:

  • While that does seem interesting and something I will probably play around with it is in no way a solution to this. The computers I use do not all allow me to use Chrome (main laptop ubuntu and work pc does not have Chrome and I do not want to start fight with IT for that). Also that is extra maintenance to set up more stuff just to do something that could (and should!!) easily be possible in standard web interface.

    It is really sad that this kind of thing does not get fixed since most stuff on GC works really well.

  • I have the same problem. It seems like it should not be a difficult fix for Garmin but would be a major improvement on data presentation. And I do agree, this problem has been around for years!

    3 seconds of walking and the graph axis is warped. Same problem on my iPhone 11.