This discussion has been locked.
You can no longer post new replies to this discussion. If you have a question you can start a new discussion

Elevation Graph - any way to adjust the scale?

My Garmin Connect cycling activity page shows the elevation on a graph with a vertical-axis scale that goes from -100m to 100m. This results in the entire ride looking extremely flat, even though I had to climb some slopes. Is there any way to adjust the scale so that it shows, for example, 0m to 100m instead?

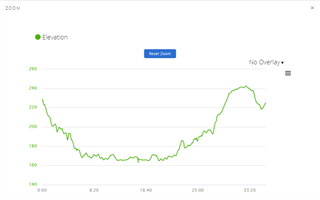
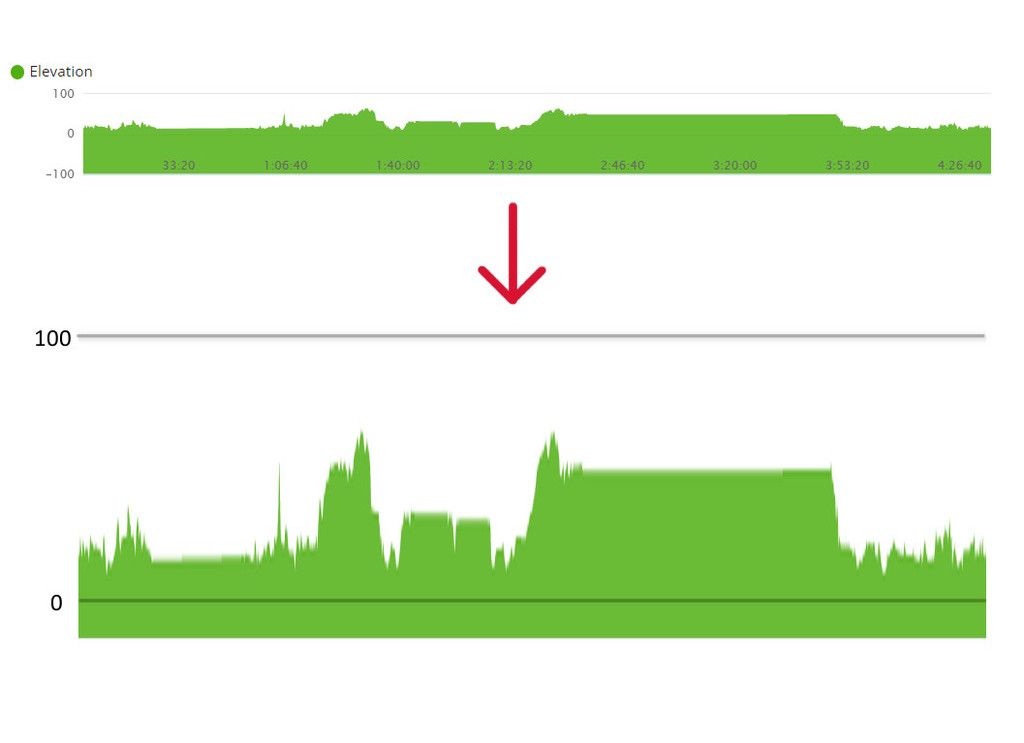
That would make the elevation graph more meaningful to me.

Below is essentially what I'm talking about.
  • I was trying to figure out a way to do this too but couldn't. My graphs look even flatter than yours due to the scale which makes them almost useless really.

    I'd also like to set the default to Distance instead of Time so I don't have to change it every time I view an activity
  • What watch do you have? If it uses GPS for elevation, the default is that elevation correction is used. If there's a span where there's not good elevation data, it likely will appear as flat... What does it look like with elevation correction off?
  • Just tried both ways on GC. Normally use Correction Disabled but when I change to Enabled I can't really tell the difference.

    Here is an example. If the scale was adjusted there would be a lot more definition, especially on the zoomed in view.

  • Enabling or disabling elevation correction has no effect on the elevation graph, it changes only the values for ascend and descent. Just another known bug in Garmin Connect :(
  • I know what you mean, Kevin301. Being able to rescale all the graphs would be very useful. It was possible with the now removed Connect Classic but when they brought out the "improved" Connect Modern version one of the improvements was to remove this option. As far as I know, the best option now is to use Zoom.
  • It's really sad that nobody in their software department thought of this. How many locations in the World require an elevation display with negative values? It would be best if we could freely configure the elevation upper and lower limits.
    For folk who don't live at sea level, it wouldn't make much sense for the graph to start at 0m.


    I find that the elevation display on my Android Garmin Connect app is better.

    So I guess I'll have to live with it for now. Hopefully Garmin staff are actually reading these forums...
  • But let's agree, the autoscale function is not a rocket science and it should be "must have" function in Garmin services. C'mon Garmin it's said that your devices are not ordinary toys so please remove such a bugs like absence of autoscale in graphs displayed in GC. It really doesn't look pro.
  • Agree, we can use app, but thats annoying.

    I was looking to scale Y axis for cadence in running..my avg is 165 and range is 160-170, whereas graph's scale is 0-200.. so almost looks flat with no variation.

  • You can adjust the Y-scale on most graphs of Garmin Connect Web, with the help of local overrides. You can then select an area on any graph to zoom it according the selection (the non-overriden version zooms only the X-axis, with GCOverrides, you can zoom both of them):

     »

  • This is pretty ridiculous. The Android app scales the Y axis for elevation appropriately, but the web graph has a Y axis that spans 1200ft despite my ride never fluctuating more than 100.