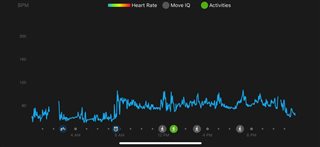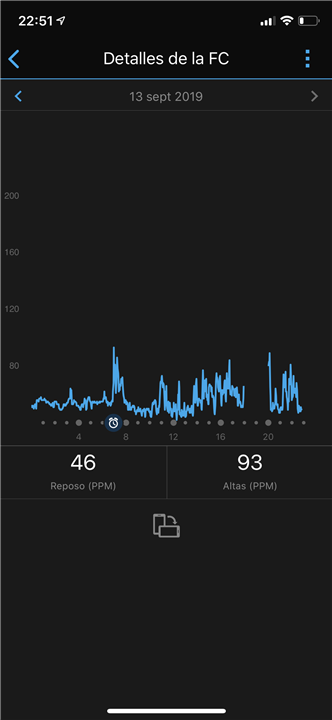
I’m new on garmin and I’m wondering why the FC daily scale is so big. This graph is imposible to read
the Max Y axis value has to be the max value of the data. No?
I’m new on garmin and I’m wondering why the FC daily scale is so big. This graph is imposible to read
the Max Y axis value has to be the max value of the data. No?