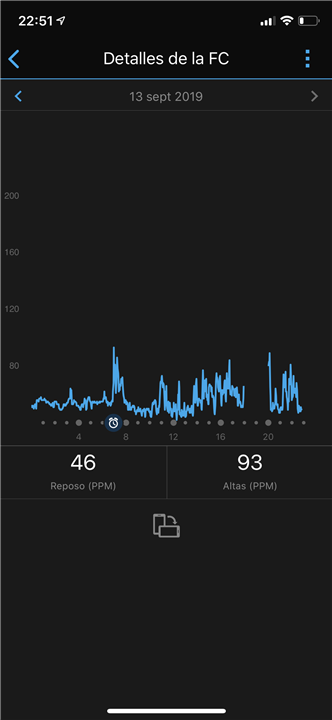
I’m new on garmin and I’m wondering why the FC daily scale is so big. This graph is imposible to read
the Max Y axis value has to be the max value of the data. No?
Depending on the persons age, fitness and level of exertion it is quite common for people to be hitting 180 bpm on their heart rate, or if a bit younger more likely around 200 bpm. I agree that it would be more user friendly to have the Y axis vary based on a person's max hr, but as others have said, just rotate the phone or look at the data via Garmin Connect Web https://connect.garmin.com/modern/