This discussion has been locked.
You can no longer post new replies to this discussion. If you have a question you can start a new discussion

Vivoactive 3 Altitude reading is slow (FW5)

Former Member
Former Member
Hello,

With FW5.0 the altimeter reading of the Vivoactive 3 is slow in cycling mode. For instance, when I cycle down a couple of hundred meters and then stop, it takes some minutes until the altimeter shows the correct reading. Here a video of the altitude reading: https://www.youtube.com/watch?v=IArAxYXg3Q4&feature=youtu.be

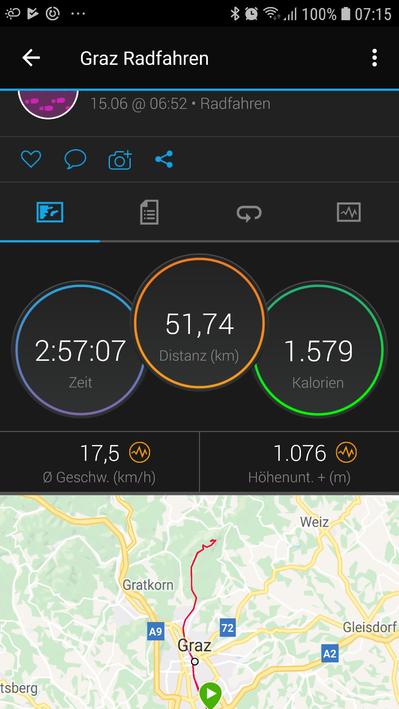
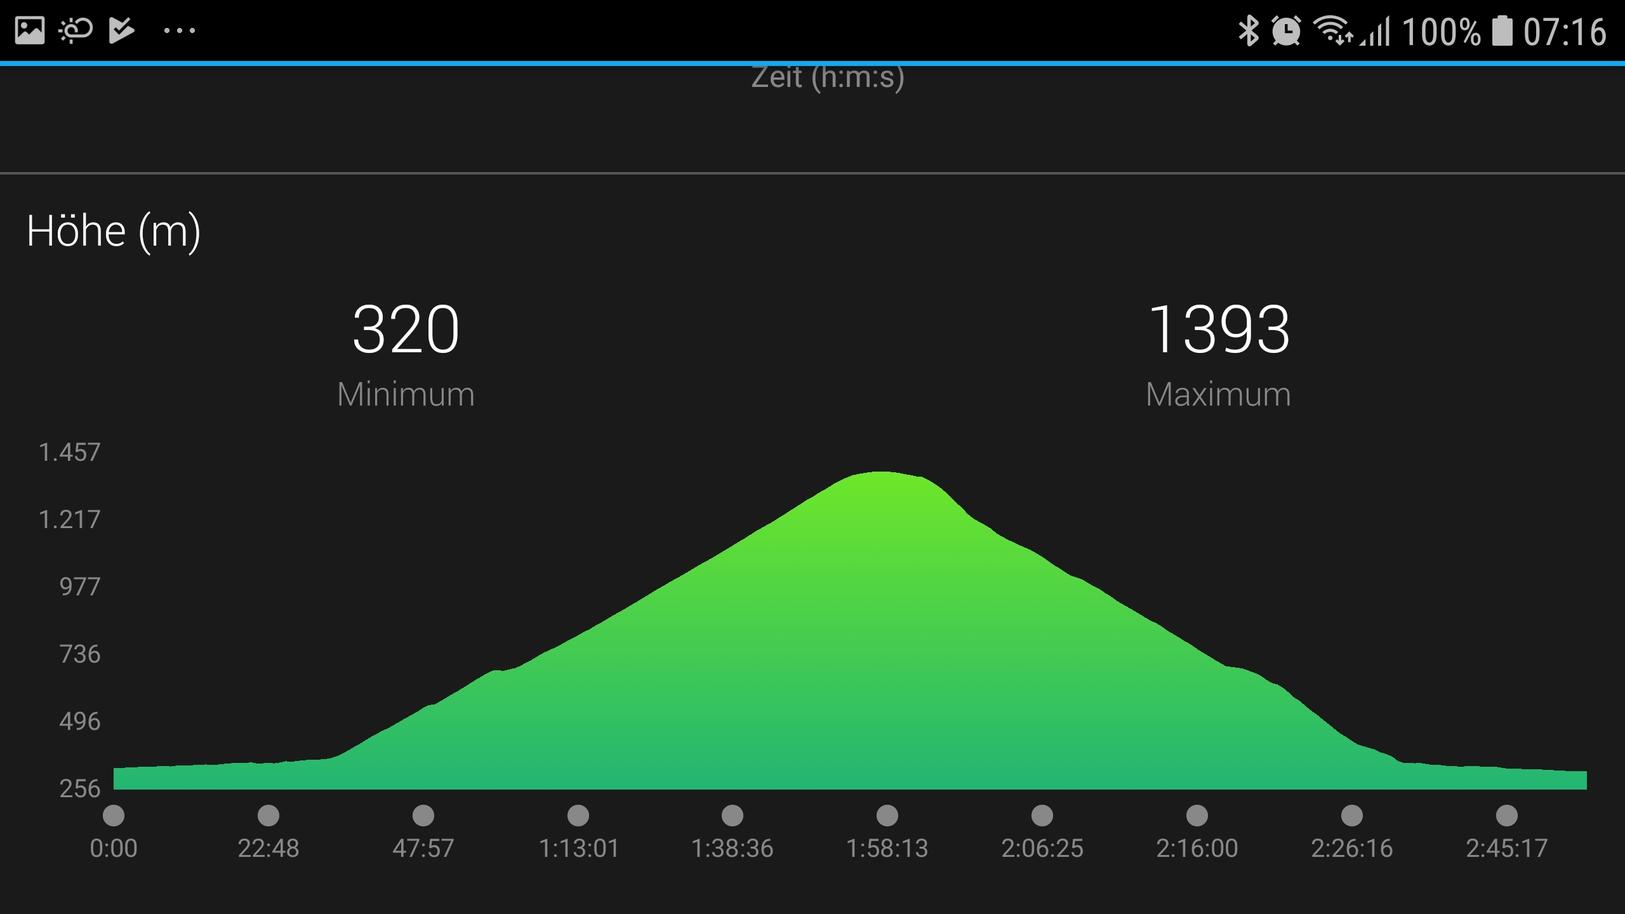
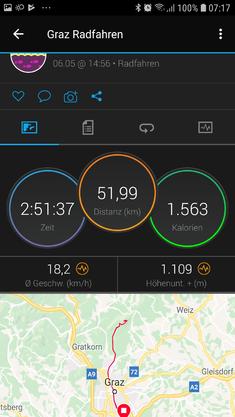
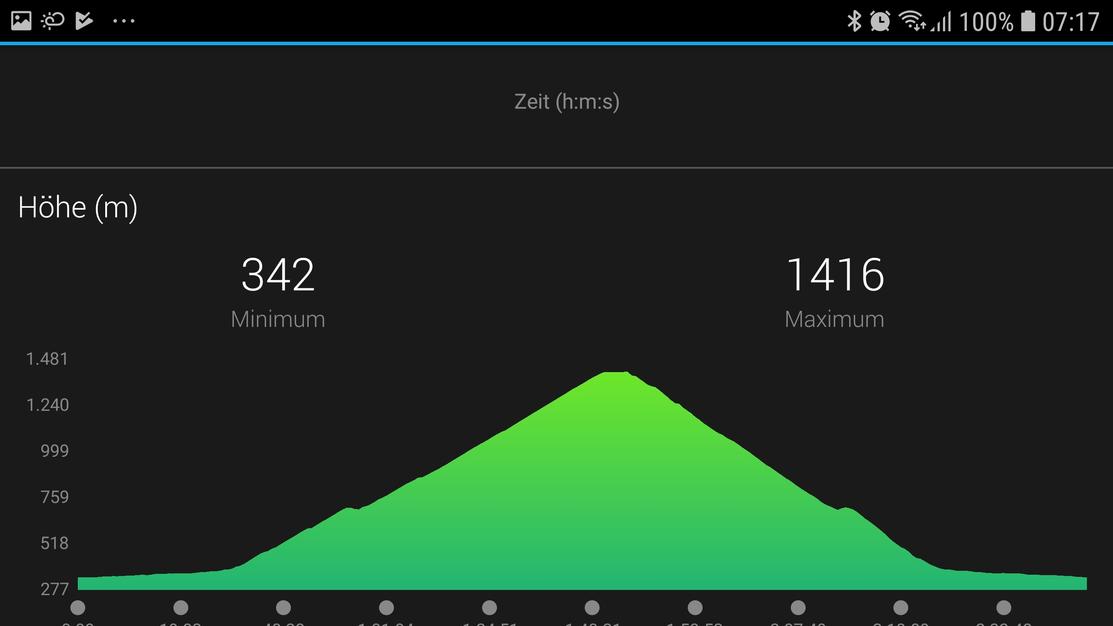
I attache some screenshots from 2 MTB rides - both done on the exact same track up and down. When cycling down, there is one counter ascent of ~ 30-40m at ~700m altitude. While this countner ascent is well seen on the altitude graph from May 6th, it is not present in the altitude graph from June 15th (FW 5-0). In total ascent ~40m are missing.

This is not a new Problem in Garmin products: End of 2016 I got a Chornos. This spring Garmin updated the Chronos FW from version 10.x to version 11. Since then, the altimeter was slow and total ascent was not correct anymore. I do mainly mountainbiking, so a correct altimeter and total ascent is important for me. Garmin has replaced my Chronos already 2 times. This time it was a software issue, and Garmin could not provide any solutions, therefore I returned the Chronos to Garmin. The Fenix 5 was no alternative, because Firmware 9 suffered the same problems.
Therefore I bought myself a VA3, which at that time, worked very well for what concerns altimeter accuracy. Now unfortunately Garmin launched FW5, and with this version the same problems appear as with the Chronos and the Fenix before.

Anyone else who has experiences similar problems with the VA3, Fenix or Chronos?

Best regards, A.S.


ciq.forums.garmin.com/.../1362528.jpg ciq.forums.garmin.com/.../1362529.jpg ciq.forums.garmin.com/.../1362530.jpg ciq.forums.garmin.com/.../1362531.jpg
  • Former Member
    0 Former Member over 7 years ago
    I recently returned my VA3 due to the poor altimeter. I found that monuting the watch on my bike instead of wearing it on my wrist made a HUGE improvement in the elevation data. I suspect that a lot of the problems with the altimeter in the VA3 have to do with the ports for the barometric altimeter being placed underneath the watch where they can get clogged by sweat. Some of the problems may also be software-related, but if I were you, I would try mounting the watch on the handle bars and see if that makes a difference.
  • Former Member
    0 Former Member over 7 years ago
    Hi, no, this will not help, it's not a hardware but firmware issue. This problem is repeatable. I have also numerous graphs recorded with the Chornos, which showed the same artefacts when Garmin changed the Chornos FW from FW10.x to FW11.
    I will return my VA3 as well.


  • I recently returned my VA3 due to the poor altimeter. I found that monuting the watch on my bike instead of wearing it on my wrist made a HUGE improvement in the elevation data. I suspect that a lot of the problems with the altimeter in the VA3 have to do with the ports for the barometric altimeter being placed underneath the watch where they can get clogged by sweat. Some of the problems may also be software-related, but if I were you, I would try mounting the watch on the handle bars and see if that makes a difference.


    Hi, How did you returned your watch, when did you purchase it ???
    I am trying to do the same for the exact same reason (altimeter and elevation not working due to port blocked by skin/sweat...
    Did you get a refund?
  • Former Member
    0 Former Member over 7 years ago
    I purchased the watch in May and returned it to the local retailer (I'm in Denmark), and they gave me a full refund.
  • That altimeter graph is displayed wrong on android device, look at times below chart. The time steps between dots should be fixed and those are still variable. From 0 to 0:22:48 step is 22:48 and from 1:58:13 to 2:06:25 step is only 8:12. This leads to distorted graph.
  • That altimeter graph is displayed wrong on android device, look at times below chart. The time steps between dots should be fixed and those are still variable. From 0 to 0:22:48 step is 22:48 and from 1:58:13 to 2:06:25 step is only 8:12. This leads to distorted graph.


    Yep, this crossed my mind, I don't have that issue on mine but I did check on the online connect dashboard, where you can graph the elevation vs time or distance. My elevation profile is totally wrong for my loop run. It should be symmetrical (same path on the way and back) in a bowl shape, the watch it's nearly a straight line downhill. -67m between start and finish.
  • That graph issue is on every android garmin connect app, the heartbeat, altitude and speed graph has variable time on graph. In my previous message I referred the graph shown on the first message on this topic. I have send couple of messages to garmin but they ignore that issue. Please attach the same graph from the garmin connect web app, you see difference. I have asked about this issue before from this forum, but nobody hasn't responded to my message. I hope that garmin fixes this issue.