This discussion has been locked.
You can no longer post new replies to this discussion. If you have a question you can start a new discussion

Where does Climbpro get it's gradients from?

Former Member
Former Member

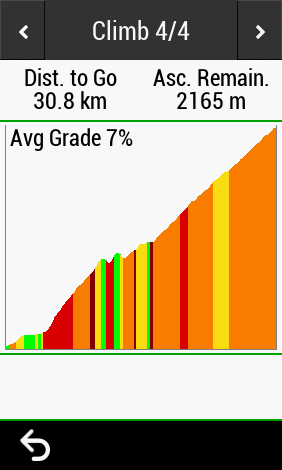
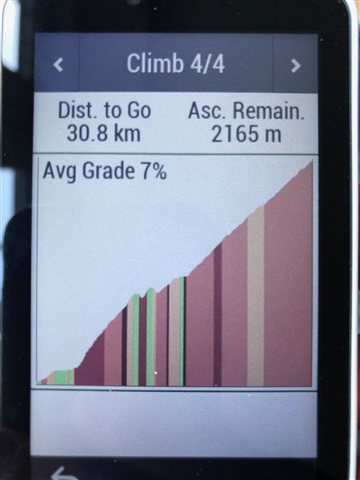
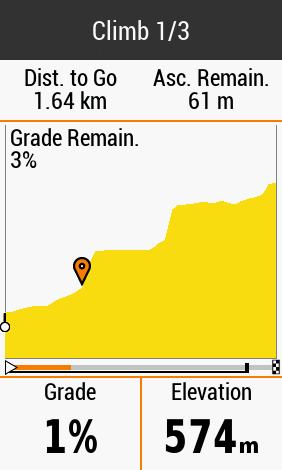
Now that my 1030 has updated to 8.0 I just tested Climbpro on a course I ride every week. I created a route for the course on RideWithGPS, exported it in GPX format, and copied it to the 1030. When I loaded the route, it found the three hills I expected, but the gradients it shows on the graph don't match reality at all. The first hill shows up as looking like a staircase, but in fact the gradient doesn't vary much during the climb:

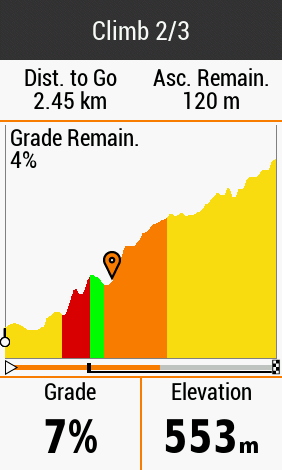
For the second climb, the Climbpro screen shows some downhill sections that don't exist at all - the gradient varies between about 2% and 11%, but at no point is there a descent during the climb:

Does the elevation information used to calculate the Climbpro screen come from the GPX file or the maps on the 1030?

  • From the gpx file. 

    In any case, there aren't many sources of elevation data.

    That is, the elevation data in the file and the map might be from the same source. 

    The Garmins can use files that are from actual rides (with the elevation recorded on the ride).

  • It comes from the GPX file and is only as good as they data the mapping site provides.

    You may want to try creating the same course on some other sites and see if the elevation data looks more realistic.

    The issue comes down to how granular the DEM information is that the sites use for the area you are creating routes for.

    The best match to reality is if you have data from a real ride recorded with a device with a barometric sensor that you can build a course from.

  •  On my device, the Climbpro screens are all muted and kinda merge in together.  Anyone got any suggestions on how to make them strong and vibrant colours?  On the left is a screenshot direct from the device, and the right is what I actually see on the device. 

  • "On my device, the Climbpro screens are all muted and kinda merge in together.  Anyone got any suggestions on how to make them strong and vibrant colours?"

    The colors being muted is a result of the special type of screen ("transreflective") being used in the Garmins.

    This allows them to be readable in the sunlight without a backlight.

    The dimness is an engineering compromise.

  • "...is only as good as they data the mapping site provides. You may want to try creating the same course on some other sites and see if the elevation data looks more realistic. The issue comes down to how granular the DEM information is that the sites use for the area you are creating routes for."

    I suspect every site is using the same DEM (elevation) data.

    From this:

    www.gislounge.com/.../

  • Maybe, but I have found differences between some sites.

    For me Strava was giving better elevation data than RWGPS, but that might be restricted to the area I was creating routes in.

  • Although I haven't compared RWGPS with any other course planners I have been noticing that RWGPS seems to be underestimating the ascent by some margin for courses I've planned here in the UK compared to the recorded ascent.

    Ironically the estimated total ascent that the edge displays for the calculated course, which used to be wildly inaccurate has in general been closer to the recorded values.

  • "Maybe, but I have found differences between some sites."

    Strava certainly isn't using it's own maps (it's using the same maps as everybody else). It seems likely they are doing that with DEM data too (Strava probably doesn't have a secrete source of DEM data).

    I wonder if the difference is how they do interpolation. That is, maybe the difference isn't the data but how it's being used.

    I don't think there are many readily-available sources for wide-spread DEM data. The SRTM data is one standard source (It's easy to get a copy). The mapping companies (Google, Garmin, Magellan) might be collecting it during their surveys. Google has an API to get the elevation.

  • "...seems to be underestimating the ascent..."

    The estimated elevation might be missing bumps in between the data points. It's not surprising there's a difference (and that the estimate is often lower).

    It's not clear how much of a bump should be included in the measurement. Should it include every little 1 inch bump?

    In any case, the elevation gain is not a great measurement of ride difficulty since it doesn't include grade.

  • This is kind of a weird suggestion, but the Oakley Prizm Trail lenses make the colors pop waaaay more.