
Dear community (and of course Garmin),
I have a question regarding a data field on my Forerunner 955 Solar.
I recently started to use a power meter on my bike and played around with some custimization of my data screens.
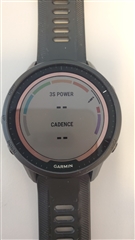
I found a whole data screen to choose, which is called "power", showing color bars for the power zones, 3s power and cadence (first photo). This whole screen is not customizable (so I cannot change it or add any data fields to that).
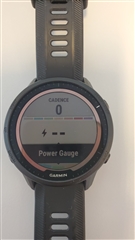
As I would also like to see my heart rate together with power and cadence, I created a new data screen with 3 data fields. For power data fields I found a "power gauge", also including color bars for the power zones (second photo), which I find useful and a power value. I tried to find out which power value that is (instant or maybe also 3s average like in the other dedicated power data screen), but I did not find a description of this data field on the internet so far.
Can anyone tell me, which power value is shown in this data field? (As it´s pouring down at the moment I did not yet have the chance to test it and perhaps find out by myself if this is an instant value).
Thanks a lot for any information!
