This discussion has been locked.
You can no longer post new replies to this discussion. If you have a question you can start a new discussion

New heart rate graph scale is confusing

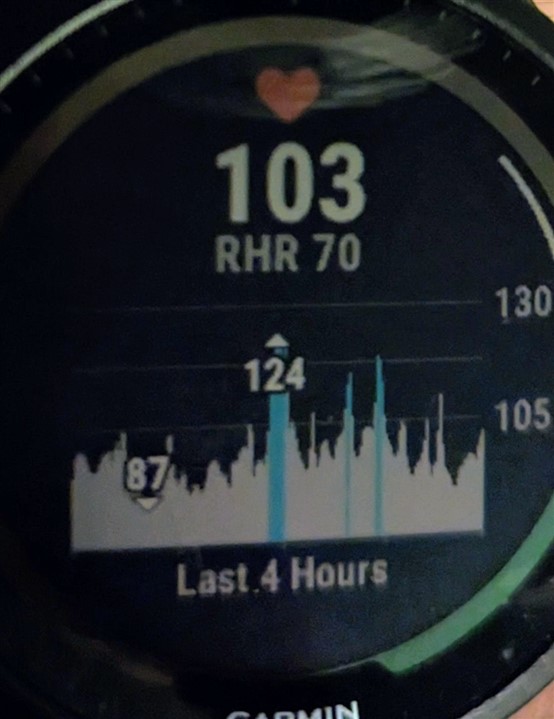
The new release of the firmware (13.22) scales the heartrate range between the min and max values for the current 4 hour period. I see why this was implemented but it's definitely not as useful for me and I'd prefer to go back to a fixed range.

Having the option to set a fixed range is better because then at a glance I can compare my heartrate to previous observations. If it has this dynamic range the scales between min and max it takes longer to figure out what the data means as I need to adjust my assessment to a different scale each time I look.

We need to have an option to switch to a fixed scale (50-200 or something) 

  • Never used it, too small for my eyes, i look to it in garmin connect on phone

  • I never liked the algorithm Garmin uses to determine both the min/max but more importantly the horizontal lines on the graphs.

    For example, on the screen capture you post, how are we supposed to know what the horizonal line between 105 and 130 is?  If you do the math, you would calculate 130-105 = 25 / 2 = 12.5.  So the in between line would be 105+12.5 = 117.5!

    Seriously Garmin?  No programming languages like Python or Matlab ever determin plotting intervals like that because they are not readable / interpretable / actionable.