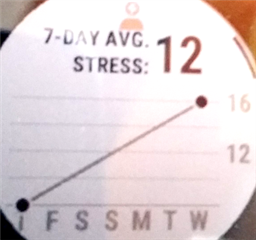
I'm not sure (not viewed this widget before), is it supposed to look like this?

I got a value on each day. Start by checking that you got stress values for each day: https://connect.garmin.com/modern/report/63/wellness/last_seven_days
You can also check the stress measurement for each day. This is for yesterday: https://connect.garmin.com/modern/daily-summary/2021-06-22/stress
If you edit the date in the URL you will see the stress graph without scrolling. If you click the back and forward arrows you will end up in the top of the daily summary page and have to scroll down to see the graph.
Thanks - I forgot to mention the data isn't synced to Connect, so I can't check that, but the data is in the monitor .fit files for sure (my homebrew software does get the average stresslevel per day out of it).
I have a hunch that this relates to a late-shifted work/sleep schedule, and having lied to the watch about my sleep time because I want DoNotDisturb on for 2-3 hours before I go to sleep.