This discussion has been locked.
You can no longer post new replies to this discussion. If you have a question you can start a new discussion

Understanding Performance Condition Graph

So I have a pretty good idea what the "performance condition" number that pops up on my watch in the first mile or so of my run means.  It's a quick assessment of how fresh/fatigued I am for that particular run.  It's a neat concept but like most of these metrics i'm skeptical.

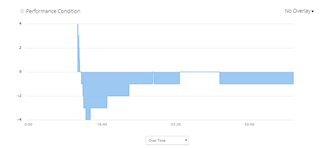
But I don't really understand the graph that shows up in Garmin Connect for the activity afterwards.  This morning's run for example, performance condition popped up and said I was a +3 for the run.  That's not bad, I'm usually seeing a max of +5 so +3 is doing okay.  I set it aside and didn't think about it again.

But looking at the graph, post run, my performance condition proceeded to plummet immediately afterwards, well into the negative.  What am I supposed to derive from that?

  • How did the HR graph look for this activity?

  • That is awfully strange that it come up with a PerfCondition for you and display it, while then promptly going negative.  Usually for me it is a smooth slow transition.  As the run progresses typically it will drop as your breathing and HR get more stressed/ragged.  

    It won't display a result for really easy runs so going from positive to zero... or even negative is common, reflects the stress your body is succumbed to during a strong run.  Your heart rate variability will slowly creep up.  However being that it is effected by Pace, HR, and HRV... a lot can effect the reading.  If you happened to be going downhill when it first gave teh reading.. promptly slowing and going up a hill... it would drive the PerfCond down (thinking your HR just went up at  slow pace).  You respiration rate can also is a good indicator of HRV i think.  So many variables in equation.

    If using Wrist HR, results could be a bit 'rough' as it has a harder time detecting exact live HR, missing beats here and there.  Hence doing a HRV Stress Test activity... a strap is required to get a comfirmed good result.  

    A couple cases pointing to these issues just this week for me.  

    Nice sustained aerobic pace... gave me a result, 4...quickly went to 3, 2,1,0.... cuz I slowed as I went up a gradual hill.  it stayed at 0 for run... until I started running on the shoulder/gravel late in run... went to -1 !

    Later in Week did a Fartlek run with sprints and easy running between... didn't give a PerfCond until 30minutes in during a recovery portion... -3 !  Cuz HR was slowly coming down but I was jogging along.

  • Good questions, I wish I had thought to overlay with another metric on the original, but here is the same graph with both Respiration Rate and HR overlayed.  FYI - I do not use WHR, I always use an external HRM.

    There is a strange dip in the respiration rate right before the performance condition gets "measured" but otherwise HR seems perfectly normal.

  • Did you recently adjust manualy your HF max and or zone's ?

  • Actually, pace overlayed with HR would be more useful to see what is going on, as they are the two main drivers of PC.

    My guess is that the first negative reading is a measurement error, and then it slowly recovers to neutral, before picking up the natural increase in fatigue towards the end of the run.

    Some GPS issues around the 10-15 minute mark would be one simple explanation.

  • I would say this is down to slow HR ramp up with the effort. Your effort was already higher whilst your HR at around 12 minute mark was still slowly coming up so FirstBeat interpreted that as good +3. A few minutes later when your HR finally caught up with the effort, you got more accurate value.

    Slow HR ramp could be due to short (not enough) warm up or chronic fatigue. Try adding some strides into your warm up or take some rest days if it's down to chronic fatigue.

  • I believe that most of the comments already made, indicate that there are many measurements taken during the run, which are all factored into the equation of your performance condition. Only one of the measures needs to be a wee bit off, and the result of the calculation can have very different results. We're dealing with consumer products (not medical and/or military), so there is a good chance that somewhere during an activity there is some weird measurement taken (OHR reading, chest stap a bit too loose, GPS flaws, etc), effecting the results. Over the entire activity though, it's usually quite okay.

    Now, I also read that there were some issues reported in the same timeframe as your post, that OHR reading were higher during activities that normal. Maybe that would explain why your performance condition graph shows up like this.

  • No, they're the same.

  • Now, I also read that there were some issues reported in the same timeframe as your post, that OHR reading were higher during activities that normal. Maybe that would explain why your performance condition graph shows up like this.

    I mentioned earlier that I don't use WHR, I always use an external strap.  

    Agree though that it made an errant measurement *some*where between pace (from footpod) or HR as it seems those are the two factors in the measurement.