This discussion has been locked.
You can no longer post new replies to this discussion. If you have a question you can start a new discussion

HRR zones incorrect

I’ve noticed that the HRR zones on the watch are not reflecting what is set in Garmin Connect or manual calculations. Basically, HRR zones on the watch are identical to HRmax zones.

When set in Garmin Connect, the zones accurately reflect the difference (even though it’s hard to check with Connect not showing the BPM unless you switch to BPM zones). 

Any possible solutions? 

  • Yes, for sure. As you say, I have also observed both anaerobic and aerobic TE distribute across the horizontal bars. On the “Base/Tempo” question, I’m pretty sure that “Low Aerobic/High Aerobic” is “winner-take-all” in the horizontal graph as well as the vertical. Either the workout is bucketed as “Base” and the bottom line grows, or “Tempo“ and the orange line grows. At least that it what I’ve observed now more than once. Prior week tagged as Base, and I had a vertical teal bar and the horizontal teal bar grew appreciably longer. This weekend I had a vertical orange Tempo bar, and there was no change in the horizontal teal Low Aerobic, but the orange Highly Aerobic shot way over the end of the “optimal” range.

    Based on your understanding of EPOC and the watch, what would be the one outdoor running workout (or workouts) most likely to generate the highest anaerobic TE? Not because I want to make that my training routine, but to help calibrate my understanding what the watch is doing. I understand the graphs you posted (and saw them again in the FirstBeat paper), but I’d be interested what you think that would look like. E.g., not “what is the best anaerobic running workout,” but “what would be the most efficient routine to cause the watch to log the highest anaerobic TE.”

    Thanks!!

  • what would be the most efficient routine to cause the watch to log the highest anaerobic TE

    I have been browsing my indoor biking and run workouts since i got the watch. 

    Working your anaerobic capacity (FRC) is very personal and we all have different shapes for our pace-duration curve or power-duration curve. Each person has to find the right anaerobic interval duration to an essence burn quickly through the locally stored energy and give no chance for the aerobic system to catch up. A tool like WKO5 can automatically calculate the ideal target ranges and duration ranges for Pmax, Pmax/FR, FRC ot FTP/FRC training. So the following is very individualized in nature, and the values are from my experience:

    - anaerobic TE above 3.0 is obtained through 6 to 10 repeats of maximal steady effort in the 45s to 75s. If I could do more than 10, I would...

    - operative keywork here is "maximal steady effort" and that is across the intervals. So the initial intervals are not perceived as maximal, only the last ones :-)

    - go shorter, and I might have a "sprint" workout; go longer and I end up with a VO2 Max or tempo workout (see below)

    - rest period has to be zone 1. Go higher, and you might end up in tempo territory. Best to walk for runs.

    - rest period has to be at least 1mn, up to 2:30 or about. Go shorter and you might end up with a tempo workout, albeit a high anerobic TE. A 2 block of 10 times 30s maximal /30s rest has ended in tempo. Going longer and the more EPOC decay you will have, so it will be hard to get the successive intervals to increase the peak EPOC. As a result your anaerobic TE may flatten out earlier in the workout.

    - anerobic range anaerobic run workouts do generate the highest anaerobic TE

    - my best anaerobic TE was 3.7, with 10 repeats of 400m at maximal steady pace with 1mn recovery. I cannot run 400m in 60s, so I was afraid the shorter rest would bump me down to tempo label, but no, it worked out.

  • Reading back over all this, I‘ve now come full circle, LOL! I started the original thread because I was trying to replicate my old 400m max effort intervals with 1:1 HIIT repetitions on the elliptical, which in my mind should have been registering some decent anaerobic training effect. And yet I wasn’t seeing that on the watch. Makes sense now. 

  • Went to the track today. 8x200 sprints. Anaerobic TE 3.5. Nice purple bars in Load screens. All is right in the world! Also way more fun than the elliptical; I forgot how much I like track workouts. TE diminshed towards the end, no way my HR was getting back to zone 1 in a minute. That or I was starting to slow down. Or both?

  • TE diminshed towards the end, no way my HR was getting back to zone 1 in a minute. That or I was starting to slow down. Or both?

    Did it really decrease or was the rate of increase slowing down? 

    It is normal to see the anaerobic TE peak somewhere in the middle/second part of an anaerobic workout. This will vary depending on the length of rest but the typical pattern is to see a rapid increase (maybe between 0.5 and 1.5) in the early intervals) and a slower increase afterwards (maybe between 0.1 and 0.2).

    This is because the peak EPOC is what the watch is looking for, not the total amount of time spent at a particular level of effort.

    When you design an anaerobic effort, you always try to maximize the time spent in the target zone while minimizing the cost (ie the need for recovery) of the workout.

    For example, depending on the individual, one could do 4mn at 140% of threshold only once. But the same individual could do 8x1mn at the same level with with rest intervals.

    However, the watch will still be looking at peak anaerobic EPOC, which can occur before the end of the workout.

  • Ah, yes, rate of increase was slowing. Early reps showed large TE, and then started to taper off, then only small increases.

    How would any workout sequence ever clip 4, 4.5, 5 of anaerobic TE? It seems like EPOC peaks around the middle, when the TE is about 3. If your own personal best is 3.7, maybe that’s the best anyone can do?

    A related question is this: physiologically, is there much reason to “press on” after peak EPOC? Is the watch basically correct and once you are in the .1, .2 range of TE for each subsequent rep its probably time to pack it in?

  • If your own personal best is 3.7, maybe that’s the best anyone can do?

    Nah... I am 100% confident that athletes training for short distances do many more repeats than I do. I max out at 10x400m, but I have seen training plans where the repeats go to 15+. Of course, it depends on the pace. I am not fast. A track athlete will train a high number of repeats or they will have to run faster each repeat. Their coach will make sure they only have a couple of repeats left in them at the end of the workout, if any.

    Is the watch basically correct

    In the white paper about EPOC, Firstbeat publishes the standard error of their EPOC model, but not in %. Simplifying and using the sample size, I estimated it is around 8%. This is pretty good for life sciences (the VO2 Max model is at 5% if the HR Max is correct).

    its probably time to pack it in?

    As I was saying above, you typicall want to run as many repeats as you can, steady pace, save for 1 or 2 reps max. This would be a good workout. Needless to say, this is very demanding on the body and its better to be young and healthy to do this.

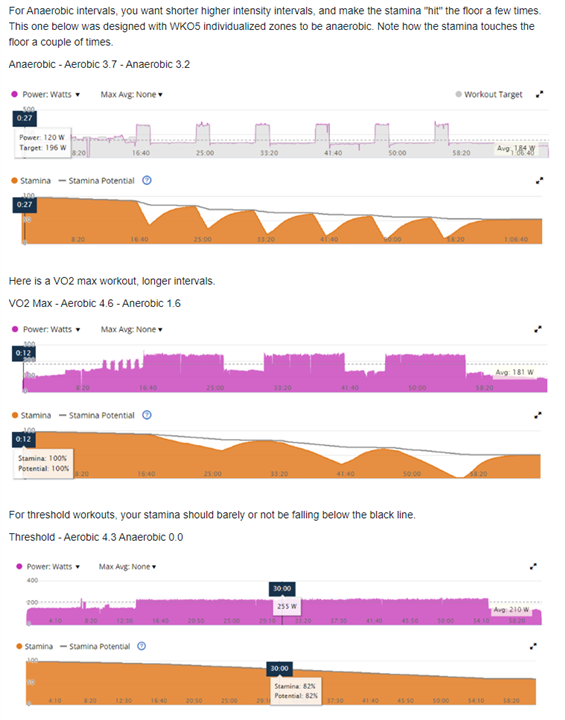
    Another way to look at how far you need to go (aside from the AnTE potentially plateauing is the stamina. For an anaerobic workout, you are training to maximize your anaerobic capacity, so you should see over time that it takes more repeats to deplete your stamina, all things being equal. That would be a sign that you anaerobic capacity is increasing.

    Here is a post where I share some stamina depletion profiles for different types of workouts (cycling)

    https://forums.garmin.com/outdoor-recreation/outdoor-recreation/f/fenix-7-series/316362/garmin-training-plan-a-joke-pro-athlete#pifragment-1292=3

    Here is stamina profile for the workout where i got 3.7 anaerobic mid-october. The fact that I am crushing the stamina early and then additionally lose the ability to recover stamina during the rest period is a sign that (a) the rest periods are not long enough and/or (b) the watch is under estimating my anaerobic capacity.

    Here is the same workout today, I increased the rest periodes to 2mn instead of 1mn

    This is a much better workout. You can see that resting more actually recovers stamina, while the peaks after recovery still decrease nicely. However, I should not see a flat null stamina in intervals before the last ones. So, assuming that the watch is not underestimating my anaerobic capacity, I could/should rest a bit longer so that each interval is bringing the stamina down and the last interval to zero (I would have about 5mn of tank left then, which would be an interval + rest or about).

    The thing is, increasing your anaerobic capacity will helpt you run faster longer byt may take away from your threshold performance, in particular if you train your intensive anaerobic capacity (close to sprints). For endurance athletes, the extensive anaerobic capacity (closer to VO2Max/FTP levels) is more useful. There is a trade off here.

  • I learn so much every time you post. I'm working through all the charts, seems to all make sense. And also explains why an interval workout that initially was racking up high AnTE started to diminish over the weeks -- I was getting more fit and doing the same workout over and over meant I was improving less. Which should  have been obvious, but I remember feeling like something was wrong. In fact, something was *right*, LOL! The Stamina graphs are super helpful, along with all your commentary!!

  • I’m also finally internalizing that EPOC can peak mid-way through a routine, which is why TE can be large and chunky in the early reps and then get much smaller towards the end. That was my initial confusion. I had assumed that each rep was a “unit of work” vis-a-vis TE, and each unit would have more or less the same TE which would all just stack up as I go. More reps would chunk out more TE at some predictable rate. Which isn’t entirely irrational, but clear from all your charts, not how it works under the hood.

  • Just thinking - it would seem useful for there to be a drill down on TE that shows the EPOC graph overlaid with HR and Pace/Power, no? That would show explicitly what is going on. Any reason that couldn’t be a real-time display? Maybe also “Contribution to TE” as an overlay too. It would basically illustrate everything you have spent so much time trying to explain to us boneheads!