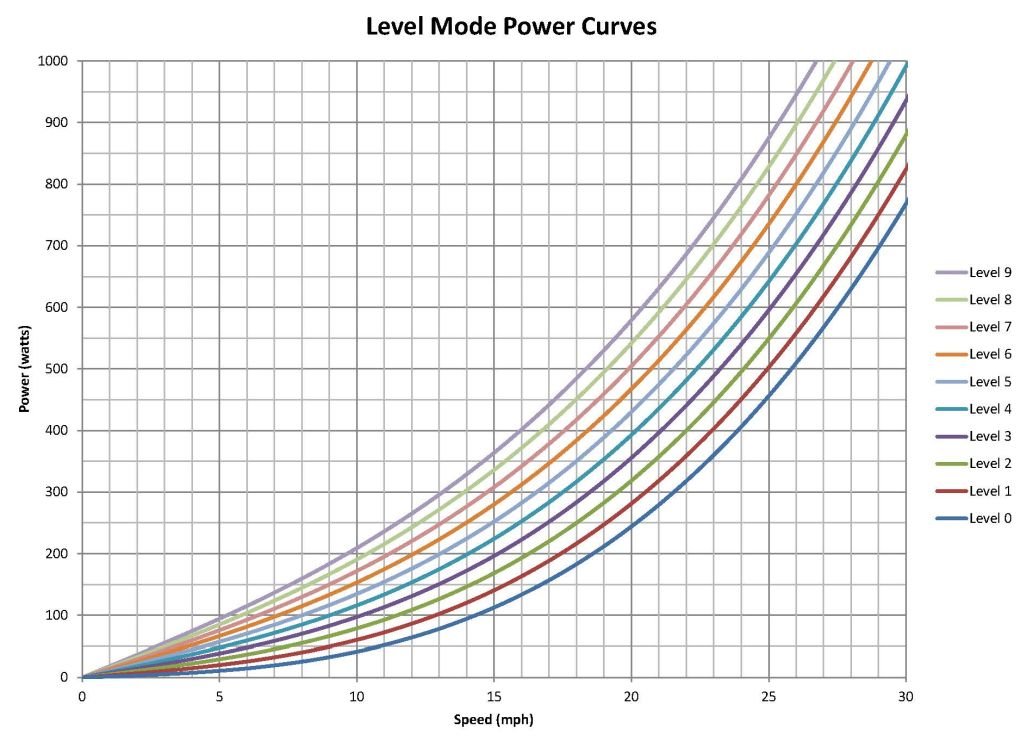
WAHOO provides them for the KICKR, surely TACX/GARMIN have provided something similar for the premium NEO 1/2/2T units?

WAHOO provides them for the KICKR, surely TACX/GARMIN have provided something similar for the premium NEO 1/2/2T units?

how do you know what method tacx uses for their slope mode? while it is certainly possible that their slope mode takes into account rider weight, it's also entirely possible they use fixed curves that allow a rider to select what resistance/slope they want to train with.
unless you work for tacx, this is pure speculation.
Two tests in slope mode:
a. 20 minutes 24.3 km/h : 90 watt average.
b. 1 minute, setslope to 5,0 %, tried to manitain at 15 km/h. Self-estimate: 200 watt average on screen.
Parameters in tacx:
body : 76 kg ; bike 9 kg , roll-resistance : 0.027 , frontal surface : 0.4 m^2
Formulas:
Pr = cr * m * g * v
Pa = 0.5 * p * c * (v + w)^2 * v
Pc = i / 100 * m * g * v
( explantions on request)
Calculations:
a. Pr = 15 watt ; Pa = 74 watt. Total: 89 watt.
b. Pr = 9 watt ; Pa = 17 watt ; Pc = 174 watt. Total: 200 watt.
Conclusion:
Tacx takes all, the in physics used, parameters into account for the needed wattage at a certain speed with a, by the user selectable, slope.
Therefore to publish a graph can only be done meaningful in private mode, not as suggested by your graph in general, without explainations of used parameter-values.
q.e.d.
yes, that's the point...
analyticcycling.com/ForcesPower_Page.html

since you've provided your formula and inputs....why not share a power-file of *your* test showing the speed/wattage values while varying speed (independent) to illustrate power (dependent).
that way we can compare the entire curve...and see how well the actuals track to the predicted.