Looking for Data Field Bar Chart of HR Zones during activity

Hi, I'm looking for a data field bar chart which shows HR Zones for the current activity. 

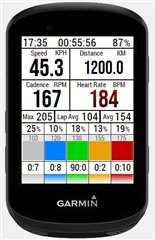
I would like it to show the same information you can find in Garmin Connect at the end of the activity (coloured bar chart showing time in each zone as a percentage of total time). This though would be for the current activity presented as a bar chart. It could be for use as a while page on the 530, I don't mind.

I assumed it would be available but I can't find one. Can anyone point me in the right direction please? 

Thanks!

  • Look amongst the in "Connect IQ". I use one I downloaded from that site and modified it using the "DIY" app for my own use to record the times I have been in zones as I ride.

    Alternatively create your own using the "DIY" app.

  • Hi, I´ve used this data field for years on EDGE 530, 830 and Fenix6 and I like it very much:
    https://apps.garmin.com/es-ES/apps/4885b1e1-7102-4c66-8600-c69f911780d6

    And I've just found this other one that looks interesting and seems to be exactly what you are looking for, I haven't used it yet but I will install it now and see how it goes. 
    https://apps.garmin.com/es-ES/apps/0a645845-14d0-492c-a203-3a6d9bb6e6b5?tid=1

  • I recall now, I found the one that I wanted as an example amongst examples of what you can do with the "HMs DIY" tool for creating layouts. I could not see any that where much use in the Connect IQ, they were all too basic.

    So I just altered the example to my requirements using the tool.

    The bottom bars indicate what zone I am in, The numerics above are for amount of time in zone, the bars above that are graphical and show as a chart how much time I was in a zone, above the bars are numerics indicating max HR in a zone which helps me keep in a specific zone and not exceed it, above that perecentage time of ride in a zone for when I am doing the likes of 80/20 training. above that the max, lap avg and overall avg of my HR and the to the right HR which changes colour to matche the bars below and will start to flash if I get too high, rest of the fields are self explanatory and on the very top from left, time of Sunset which I use for long multi day endurance events to help me remeber when to start preparing for night time riding, then ride time and then battery life. All the fields are editable to anything else and I have different versions of the layout for different events.


  • Ah thank you so much @eydeman. That second one does exactly what I wanted. I have tried loads of other CIQ apps so thank you for finding that one