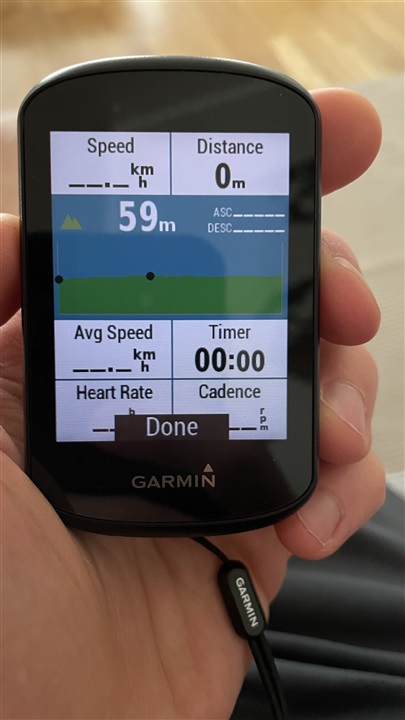

Thanks! And is my position always in the beginning of the chart?
Your position is at the leading edge, which is the right hand side. This is easier to tell when the timer is running and you are moving.
So I don’t see what’s coming but what passed instead?
Correct.
It shows history.
On the 530 you can only see future the future elevation profile when following a course or navigating and that is shown on the elevation page or on the map page if you enable show elevation profile.