
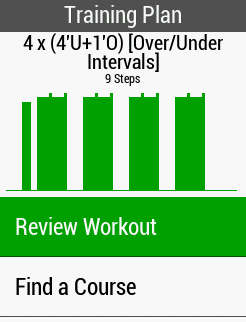
I have made workouts in Garmin Connect for some time now and I often train using HR or, less often, power targets. Currently I am using a Garmin Edge 530 (software version 9.73) and recently I noted that when previewing my over/under workout with HR targets for the reps, I was shown a graph of these targets on the workout preview page. Furthermore, the workout data field page also displayed an overlay of my current HR on this bar chart, slowly scrolling from left to right. This allowed me to guess how much time I had left, as well as to view my cardiac drift from the beginning to the end of the interval. Pretty useful.
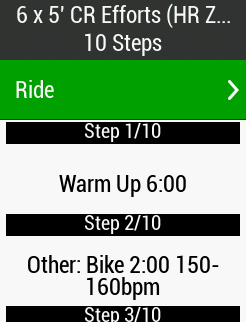
Unfortunately, not all workouts created in Garmin Connect display this feature. For example, the chart is missing for my 5-minute workout. Moreover, during the workout, the workout data field page only shows time remaining and time completed for each interval.
The question is, why do certain workouts on Garmin Connect activate this visual display of the intreval targets, whereas others don't? Thank you in advance for input!
