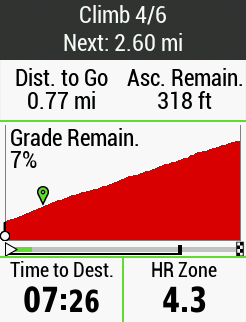
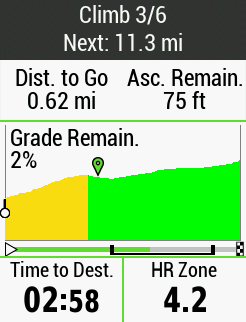
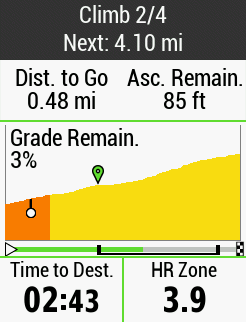
What is meant by the scale in the following pics, hopefully it may give me a better understanding of how the scale works:-
1.
2.

3.

I understand it displays how far into a climb that I am etc and something to do with the segment of it, but it is still not clear to understand at a glance whilst riding and the scale has no graduations etc for distance, why not just have a data field superimposed on the elevation for the segment your riding for distance to go on it. Overall distance for the overall climb remaining is at the top. Distance wise, the coloured bar, does not really mean anything informative to do any calculations in your head with, ie 200 metres to go on the segment etc
An additional thing I once saw but never got a screenshot was when the right hand black tick mark left the scale on the right hand side, another tick mark appeared on the left hand side and it too starting moving across the scale to the right hand side, but so far only seen it the once despite climbing the same hill a few times so it may have been a bug.
Plus in the guide, it says the scale has an orange bar, mine is green which I cannot see on the 530 as it is too fine a line to see and its only in screenshots that it does. Or does that coloured bar change colour depending on what colour you have selected for your activity profile, ie I have green for road riding and if so, then that would account for a green bar.
Also, why have at the top of the screen, which climb your on ie 2/4 and informing you when the next climb is coming up, I find no need for that information and basically, it hides space for at least two more data fields that I could use for a better purpose, ie, a lap timer, heart rate, cadence, speed. VAM etc.


