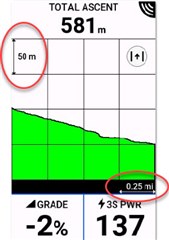
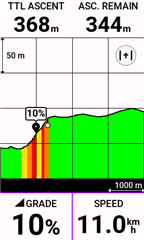
The 1040 has brought a number of changes to the elevation page and the way that elevation data is shown.
Starting from the top of the page there is a new header.
If you are navigating it reports the total amount of climbing needed to reach the destination and how much is left.

If you are just free riding the header will show how much climbing you have done

Next moving down the page is a new toggle button. This button while switch the view between a display where you can set the scale for the X and Y axis, to a view that is fully zoomed out and will show the whole course or activity data.
Here is my custom scale page with the toggle button highlight in yellow. Next to that is the page zoomed out using the toggle button. This is useful to see where you are along a course.
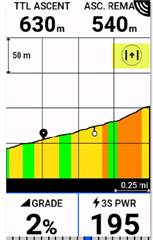
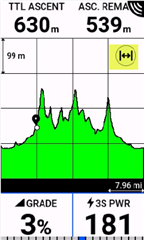
You will notice in the above images that if you are navigation that the 1040 will color code the grades when in the narrow view. When fully zoomed out it does not color the grades, but will color code the categorized climbs.
Here is a more demanding course in full width mode where ClimbPro has identified a number of categorized climbs.
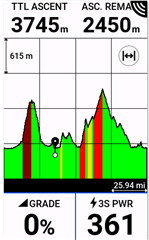
With the new grade coloring and the ability to toggle the view you may want to use a fairly zoomed in X-axis on the narrow view. For the region I'm in 0.25 miles works well.
If you are free riding then the toggle button still works allowing you to see the whole activity
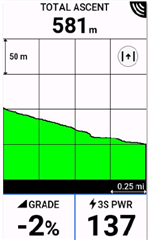
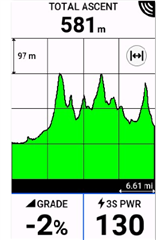
Not new, but added for completeness. You can change the scale in the narrow view by a long hold on the scale value you wish to change.
