I've always interpreted the white line as the outline of the graph and the darker shade as the fill under there. Now because there are a lot of timesteps in this graphs (more than pixels probably) and the solar intensity jumps up and down a lot (movements of wrists, cloud cover, etc.) the white line is going up and down a lot creating the illusion of some sort of white band while in reality it just a lot of crests and troughs horizontally compressed.
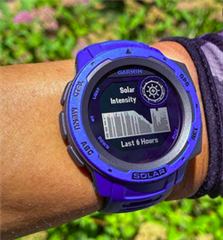
As an example; if you would take your watch off the wrist, put it in the sun with clear skies (no clouds) and just leave it steady, the white line should be much more stable (thus more horizontal instead of jumping up and down) and the darker shade should visually occupy a greater area.
Alternatively, you could interpret the darker shade as a sort of minimum solar intensity over longer duration :-)
Perhaps this conceptual image helps:
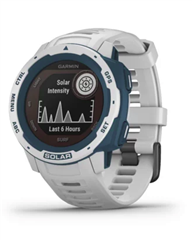
This person was in stable max intensity sunny conditions for most of the last 6 hours, except for a couple of very short intervals (white line drops to baseline):
OK, I see what you are saying. If that white line has a certain lineweight (or thickness), then yeah, I could definitely see that. I had wondered to myself if one color could respresent the solar panel behind the screen and maybe the other shade represents the solar panel around the edge. I might be overthinking things.