I really don't know how to put this into words so I'll rely on screen grabs.
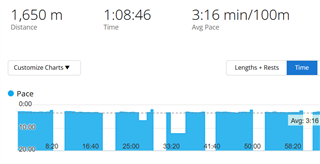
In this first image from a while back, the time data on the x-axis makes sense. 8 mins 20, 25 mins, 41mins 40 etc. I can easily map where I was in my lap swimming against how long I'd been going.
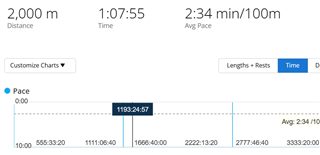
Recently, though, my data is seriously screwy. The x-axis data now makes no sense at all in terms of its hours/minutes/seconds display. If anyone has come across this and knows what causes it and fixes it, I'd love to know!