
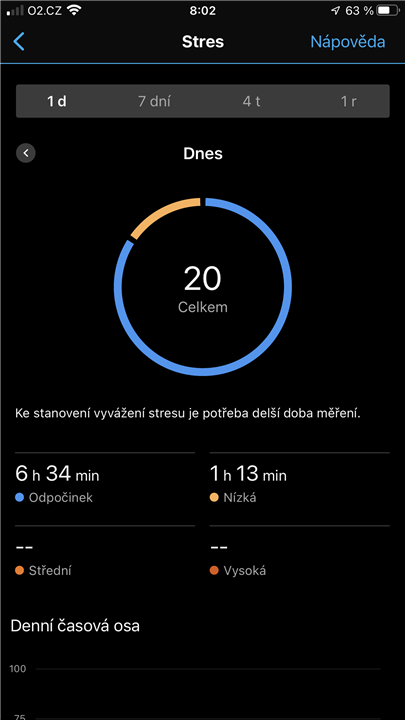
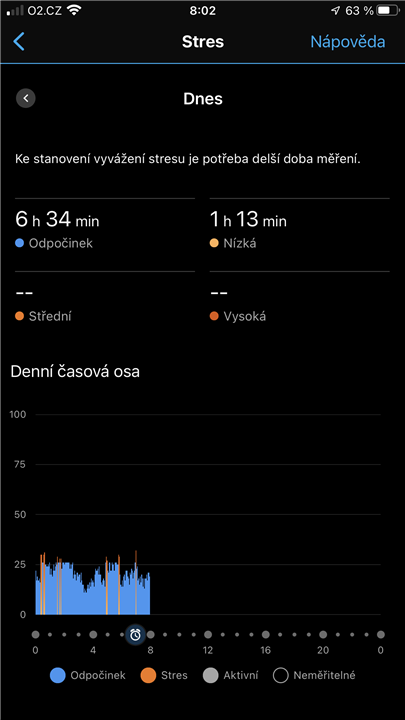
The data after wake up seems to be incorrect. Look at the pictures. Total is 20, lower stress 1 hour and 13 minutes. If you check the graph in detail, you can see that the time in the lower stress is 30 minutes max. Thank you.
The data after wake up seems to be incorrect. Look at the pictures. Total is 20, lower stress 1 hour and 13 minutes. If you check the graph in detail, you can see that the time in the lower stress is 30 minutes max. Thank you.


