(Note that this is regarding the eTrex Touch (Gen 2) and not the H1 so it's unknown if this is solely an eTrex Touch issue but I thought I'd put it out here anyways)
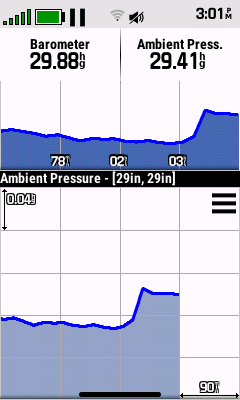
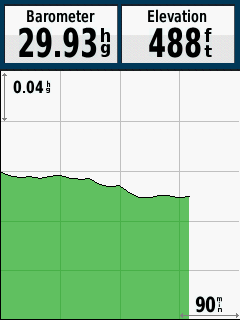
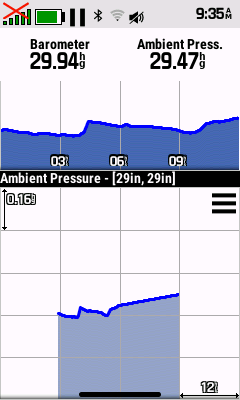
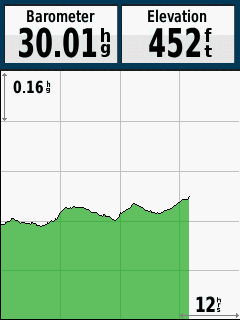
Has anyone noticed the barometer acting very strange (as far at plotting the graph goes) with v10.13? After an initial full reset (which I do after every firmware update), everything is fine and the barometric plots match pretty much exactly what my eTrex 32x shows. Over time however, the plots start to take on a mind of their own and vastly start to deviate from what the eTrex 32x shows. The plot is no longer smooth with strange spikes and dips showing rather than a smoothly curved plot. It almost seems as if readings are taken at much greater intervals with perfectly straight lines between these intervals.
All barometer settings are set exactly to what the 32x is set to:
1. Barometer Mode: Variable Elevation
2. Pressure Trending: Save Always
3. Plot Type: Ambient Pressure
All X & Y axis settings are also set the same between the two units when viewing the plotted graph.
Something seems to trigger the beginning of the irregularity but I can't pinpoint it. It could be the new setting for the GPS Stationary Filter but it's not known to me at this time...and that also should have no effect on the barometer's settings.
It could be me powering down the unit as opposed to leaving it on (as I do with the 32x) but the Pressure Trending setting is set to Save Always...maybe the unit is not actually "saving always" when the power is off as it's supposed to be doing and as it was doing in previous firmware versions (when the Pressure Trending feature was added).
I don't recall this being an issue with previous firmware but I could be wrong.
Note also that the only way to get the barometer plotting back to normal (matching the eTrex 32x which I know is correct) after it gets into this "state" is to fully reset the unit, after which, something will again trigger it into misbehaving. A full reset is the only way I know of to clear out the barometric pressure readings and the plotted graph.