Hi there,
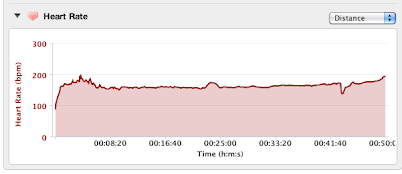
Is it possible to customize the Y axis of the 3 charts which appear on the right hand side of the Details page of each Activity. These are charts to show PACE, Eleveation and BPM. But the values of these are too big for the chart to show enough sensivity to thae changes along the run. So the graph appears almost horizontal.
Does anyone know how to change the down-up values of each chart?
regards