This discussion has been locked.
You can no longer post new replies to this discussion. If you have a question you can start a new discussion

changing pace, elevation, hr chart values

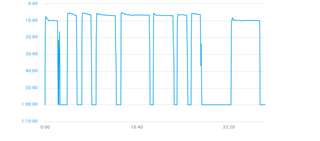
is there any way to edit the values on the pace chart and other charts. the values now are too broad to make the graph very valuable.

For example, my pace chart gives a range of pace values from 0 min/mile to 75 min/mile. the numbers are so broad that it squeezes the line into essentially a straight line. btw, who needs a 75 min/mile pace value?
  • I know what you mean. After one of the recent updates, I noticed the scale on my heart rate chart is 0 - 300. Needs much higher granularity, IMO. The "low" end of a chart should default to the lowest recorded value during the selected time and "high" end should top out at the highest recorded value. Pretty simple to me. Really hope Garmin takes a look at this.
  • zoom gone and scale issues

    I have the same issue - I do not like that the zoom function disappeared. Another issue that I have since the updates is that all my elevation charts start at 0 ft, and since I live in Colorado my runs are always at around 6-8000 ft, which makes the elevation chart a straight line. pretty useless the way it is now.
  • same elevation issue

    same issue as KOETSIER20, most of my activities are between 4500ft and 10,000 ft. Starting the chart at 0 makes even my hard climbing efforts look FLAT!
  • I agree, if you are doing an interval workout..or god forbid stop at a red light...you lose your scale for pace when running. I did ask them about it and was simply told that if enough users were having trouble they would look at it. But to me, its made the graphs unuseable. Even when you click and drag to try and zoom..it's not the same. I hope they change it back.
  • I agree the chart scales should be checked, The elevation scale minimum value is always 0, this looks ok only if the activity is near sea level, otherwise the elevation graph is vey flat, Heart Rate scales are always low limit 0 to high limit 300, they should be closer to the minimum rest heart rate, and the maximum activity heart rate, this could be set per user, or based on typical high or low values munus / plus a small buffer space, this should allow the graph to display more detail
  • Same issue as TMBASS here. Renders elevation chart useless to look at. Or, at least not very impressive unless doing a 3000' climb.
  • I'm living below sea level (I'm not joking) and can't see any elevation graphs as it doesn't show values below zero...
  • It seems elevation data scales have been modified, with the low value about 200m below the lowest track point and the high value about 100 meters over the highest track point, this way the graph does not look so flat for higher altitude tracks, but now a track near sea level has a graph starting at -200 m, which does not make much sense. heart rate charts now top at 200 bpm, but the lower value is 0, I think this should be higher, say 25, which should be fine for most people (I read Miguel Indurain rest hearth rate 28 bpm was the lowest recorded), :)
  • How strange, I checked some other of my tracks, and the heart rate graph lower value is 100bpm, and top at 180 bpm, but a specific activity is the one that has a scale starting at 0, and almost all values are over 110bpm
  • so 8 years later ...... still about unusable.

    pace at 1 hour per mile ..... all useful info is flatline