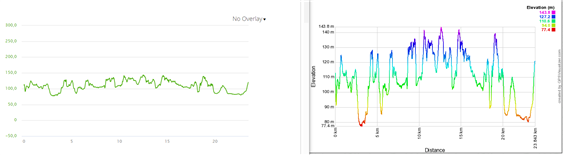
The elevation graph on GC is useless.
My "normal" run take me from an altitude of 33 meters to 67 meters MSL. The scale of the altitude graph starts -200 meter MSL and goes 100+ meters MSL. SO my run looks very flat.
I would like the elevation graph to scale, such as to exagerate the altitude as much as possible. I.e. go from 30 -> 70 meters, or exactly the 33->67 meters.
There used to be zoom buttons to make this work, but they are gone.
As for the HR graph, I am missing some option to do something almost the same, but here I want to be able to enter a minimum HR to display, such that I will only see HR from 150 to 180. If I start the watch before warming up, I will get a low HR of <60, and that makes it difficult to see changes in HR during excercise.