This discussion has been locked.
You can no longer post new replies to this discussion. If you have a question you can start a new discussion

Detailed Visual Progress Reports

Former Member
Former Member
There's already a feature to compute your average pace, distance, time, etc. over a selected time period. Why not add a section that shows you graphs of your progress over time?

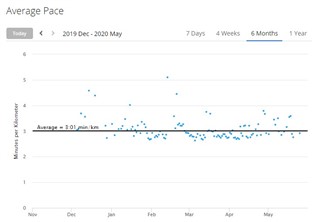
You should be able to select a field like "Pace" and specify the time as "Last month" and see a bar graph representing your average pace for each run over the last month. Each bar would represent a different workout and it would allow you to see visually how you are progressing in your training.

Data fields should include all the ones currently in the "Progress" section: pace, distance, time, cadence, HR, calories burned, etc. The time fields could be last week, last month, last year, and all activities.

Seems like every other fitness-tracking website I've used has this, and it's incredibly useful.
  • +1 I'd appreciate this too!
  • Former Member
    0 Former Member over 4 years ago

    this comment is 9 years old. Still looking at the "report" section of Gramin's Web Connect website, when a user selects 4 weeks or 6 months for instance, they only see one data point per week or month respectively. Even exporting doesn't export all of the user's data. That's useless and ridiculous. when will garmin implement decent reports? 

  • when a user selects 4 weeks or 6 months for instance, they only see one data point per week or month respectively

    It depends. Specifically at the Pace report demanded in the opening post, when you select the 4 weeks report, you see data for each day in the graph (assuming there is some data for each day available for given discipline). And it is similar for the majority of the reports, with some exceptions, where indeed weekly averages are shown and where they make more sense (i,e. the number of activites, or Activity Calories)

  • Also have a look at the GCOvrrides thread. You can enable the fine grained graphs yourself: