This discussion has been locked.
You can no longer post new replies to this discussion. If you have a question you can start a new discussion

Garmin Connect Web not showing negative values for IQ data chart

The Garmin Connect Web view for an activity no longer shows the chart for an IQ data field correctly - any negative values are not plotted and are missing from the chart. This is a new bug: it used to work correctly up to a week or so ago. It still works correctly in Garmin Connect Android App.

Here is the web view (negative values are missing)

Here is the android app view (negative values are shown correctly)
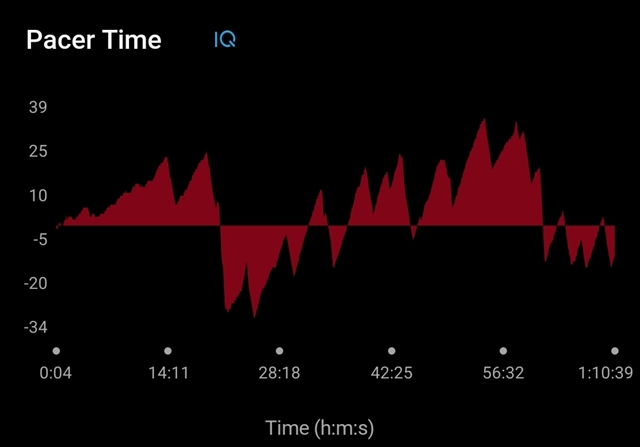
For information: the IQ app is the "Readable R&T Pacer" Data Field by developer HrMortensen

  • Same - I get this for FLOAT data! I did find a work around. You can set the data type to Signed Int, then set the precision = 2. Multiply the setData value by 100 then set toNumber(). The "precision" value will then divide it by 100 before plotting, effectively generating a floating point value with 2 decimal points of precision. I will test this today in my data field to see if GC Web will then plot negative values. Until they fix this.

  • I tried to raise this with Garmin via the Support Center Chat and they would not accept the bug report from me. They said that this had to be notified to the developer and that the developer would need to raise the issue with Garmin.

    "Please reach out to the developer via Connect IQ, when viewing this item, choose the app developer and then the option to message/report a problem." "I have checked this internally and this would be the appropriate place to report this kind of issue. If any developers wish to reach out to us directly they are able to do so."