Heart rate zones in Garmin Connect Web

Hi all, I am trying to understand how the below values are being calculated. 
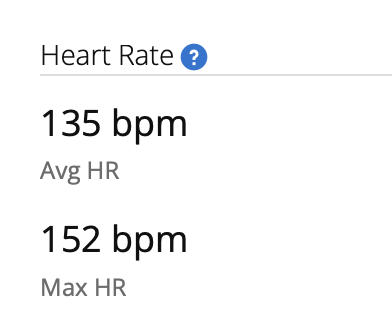
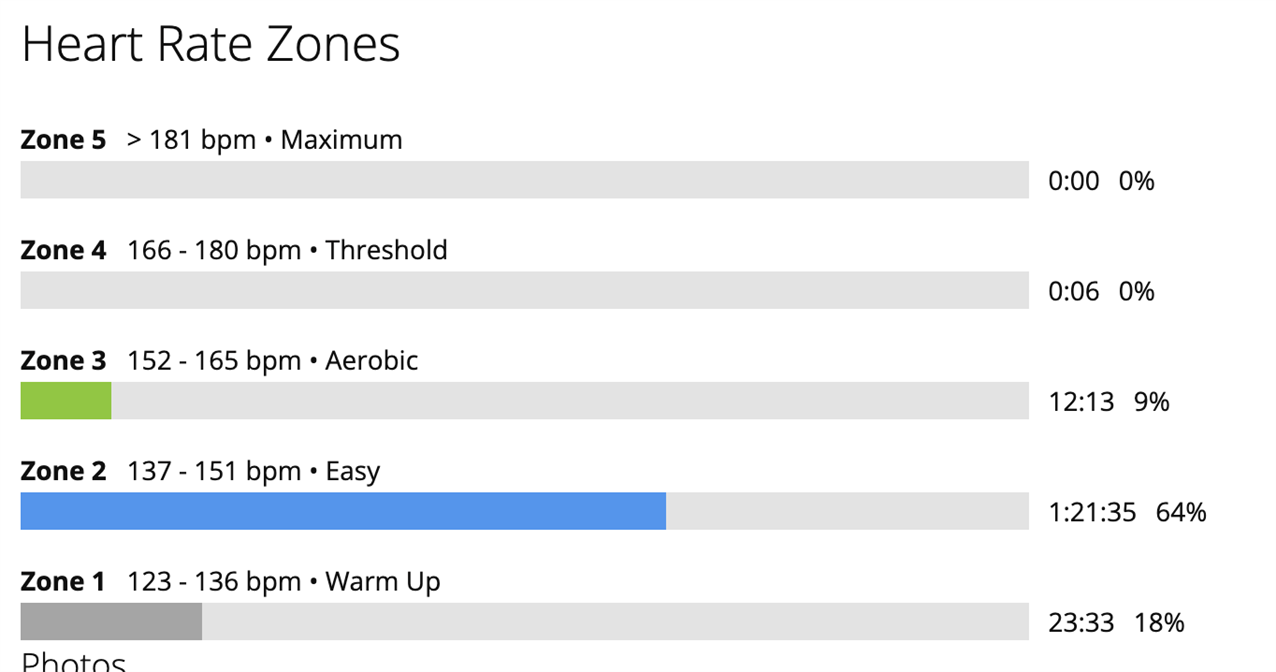
Just to make an example, have for today's run the following "time at zones" values:
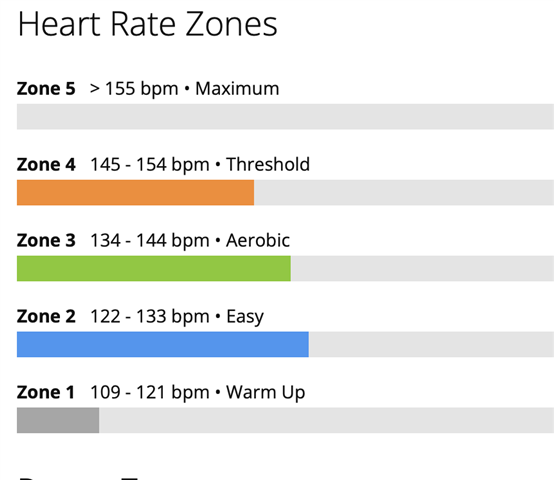
Z5 0% 

Z4 26%

Z3 30%

Z2 32%

Z1 9%

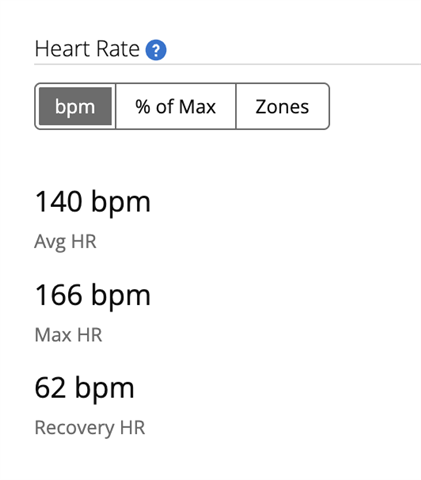
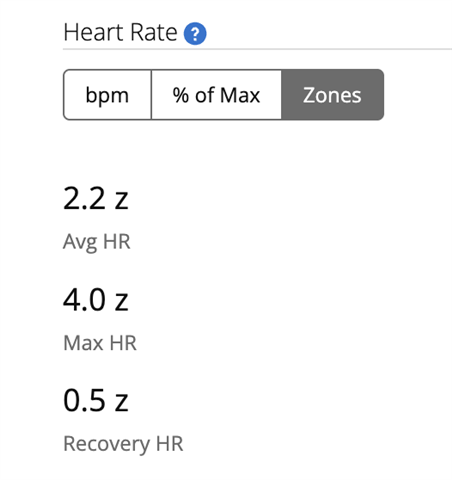
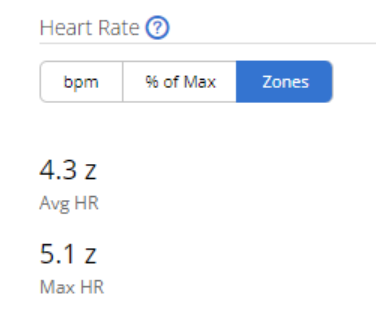
And in this case, in the HR zones I can see 3,3 z ave HR, 4,9 z max HR. How these values are calculated?  

Thanks!

  • Looks indeed strange when just seeing the data you posted (at least as long as all the data refers to the same activity), but difficult to make any definitive conclusion without seeing the full data. Could you post a link to the activity?

  • Sorry you mean the .tif file?

    Otherwise how can I post a link to the activity?

    Thanks

  • Otherwise how can I post a link to the activity?

    Open the activity in Garmin Connect Web, make it visible to Everyone (see the padlock icon in the top right corner of the page), and post here the URL from the address line of the browser. You can also use the function Share as Weblink, on the phone app.

  • I can see 3,3 z ave HR, 4,9 z max HR. How these values are calculated?  

    Those are "fractional zone" numbers and they're basically just a different way of representing the corresponding average and max values in BPM. The whole number part tells you which zone you're in and the fractional part tells you "how far into the zone" you are.

    They don't relate directly to the time in zone numbers, any more than the average and max bpm values do. Ofc there's some relationship, but you can't calculate time in zone from the average/max values or vice versa.

    For example, 4.5 z would mean that you're right in the middle of zone 4 (4.5 = 4 + 0.5 = "50% into zone 4") or halfway between zone 4 (min) and zone 5 (min).

    - 3.3 z basically means "30% into zone 3" or "zone 3 min + 30% of (zone 3 max - zone 3 min)"

    - 4.9 z means "zone 4 min + 90% of (zone 4 max - zone 4 min)".

    - 5.1 z means "zone 5 min + 10% of (max hr - zone 5 min)"

    I'll give you an example using some fake zones:

    Z1: 120-135

    Z2: 135-150

    Z3: 150-165

    Z4: 165-180

    Z5: 180-195 (max HR)

    Note that the max BPM for a given zone purposely overlaps with the min BPM for the next zone, even though the time in zones chart shows zones as non-overlapping (more on this later in the thread). When the zones are defined this way, the math described above works out, as Zone 4 min + 100% of Zone 4 will be the same as Zone 5 min + 0% of Zone 5 (for example).

    In this example, 4.3z would be:

    Z4min + 0.3 * (Z4max - Z4min)
    = 165 + 0.3 * (180-165) = 169.5

    You can verify this by switching to the BPM tab and checking those numbers against your fractional zone numbers and zone ranges.

    EDIT: one could say that this system of fractional zones doesn't really make sense from a mathematical POV, since zones aren't necessarily of uniform width (especially zone 0, which will almost certainly be "wider" than all the other zones). But I guess it makes sense as long as you don't expect the ".5" in both 3.5 z and 4.5 z to have the same meaning in terms of absolute BPM.

  • (at least as long as all the data refers to the same activity)

    It's not all from the same activity. 4.3 z avg and 5.1 z max is one activity.

    The other data with time in zones, 3.3 z avg and 4.9 z max is another activity.

  • connect.garmin.com/.../

    For whatever reason (perhaps intentional on Garmin's part), I can't see the Heart Rate > Zones or Heart Rate > % Max tabs, only the Heart Rate > BPM data for the activity you shared, but you already told us what the Zones tab said.

    For the record I will repeat it here:

    in the HR zones I can see 3,3 z ave HR, 4,9 z max HR

    And here's the HR > BPM data:

    And here's your time in zones:

    It doesn't show your max HR, but we don't need that value because neither the avg nor max zone number is 5.x.

    Here we can try to verify that the fractional zones and bpm numbers match up

    - 3.3z = zone 3 min + 0.3 * (zone 4 min - zone 3 min) = 134 + .3 * (145 - 134) = 137.3

    Hmmm that doesn't quite match up with 135, even if you account for possible rounding of either the avg HR in BPM or the fractional zone

    - 4.9z  = zone 4 min + 0.9 * (zone 5 min - zone 4 min) = 145 + 0.9 * (155 -145) = 154

    Also doesn't quite match up.

    Not sure how to explain it.

    [/quote]
  • Sorry for the weird formatting in my reply, but it's due to a forum bug and the forum won't let me fix it now.

    I will say that if I do the same calculations with one of my own running activity's avg/max fractional zones, the answers match the corresponding avg/max BPM values exactly.

    For example here's my avg/max BPM / fractional zones for a long run:

    And here's my zones, from the time in zones chart for the same run:

    2.2 z = Z2min + 0.2 * (Z3min - Z2min) =  137 + 0.2 * (152 - 137) = 140

    4.0 z = Z4min + 0 (Z5min - Z4min) = 166

    I would expect the same kind of calculation to work with all of my running activities (I've looked at this in the past, when I first tried to figure out what fractional zones numbers meant).

  • Thank you all for your help! 

    Just one point, how to define intervals. For example, for Z4 interval, why we consider (Z5 min - Z4 min) and not (Z4 max - Z4 min) it's more logical to me, without creating overlapping.

    In the expmple by flowstate, you write 2.2 z = Z2min + 0.2 * (Z3min - Z2min) =  137 + 0.2 * (152 - 137) = 140, but why not 2.2 z = Z2min + 0.2 * (Z2max - Z2min) instead. At the end, it doesn't change so much, just formally.

  • why we consider (Z5 min - Z4 min) and not (Z4 max - Z4 min)

    There would be 1 bpm gap between the zones. Technically the HR may be for example 136.8 bpm, so if the thresholds were 123-136 and 137-151, the HR of 136.8 would be in the gap. Especially for calculating averages and percentages, you have to avoid these gaps.