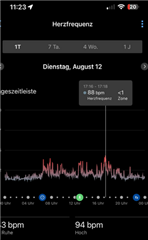
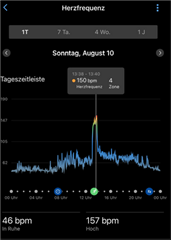
That looks like the Connect app (on your phone), not the Connect website.
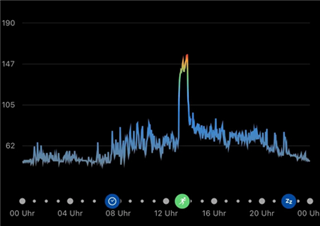
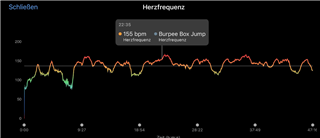
I have no idea what the reddish tint on the low HR values is. Obviously the other colours (blue, green, orange, and red on the high values) represent your HR zones (as you'll see if you long press on the graph and roll over it with your finger, which brings up an information popover about part of the data).
What happens if you long press on any of the reddish areas of the graphs? Does the info popover give you any clues?
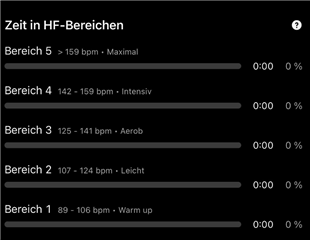
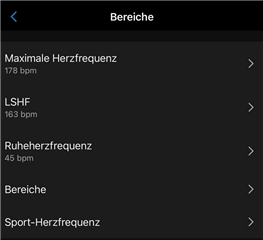
Could you post a screenshot the the table Time in Zones from the activity on August 12, and another one of the HR Zones table in the User Profile of Device Settings of your watch?
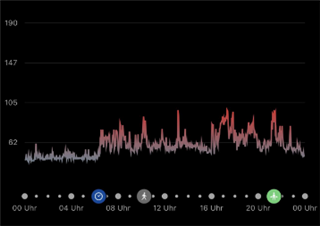
I see the color of the HR graph changing to gray, when the HR is lower than Z1. So to me it looks like your HR Zones changed between August 10 and 12, possibly due to a false, far too high Max HR or LTHR detection (depending which HRZ base you use).
Check the Max HR and LTHR values, enter credible values, and reset the HR Zones. It won't fix the past data, but should correct it from now on. You can also consider disabling the auto-detection of Max HR (resp. LTHR, if used for the base, and getting false detections)
And as for your friend - in his case I think it is the opposite situation - he has the HR Zones set far too low.
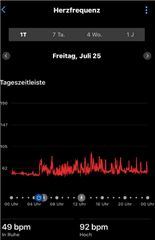
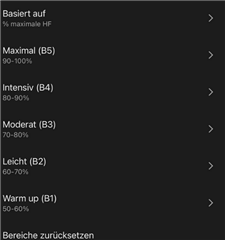
The HR Zones table seems to be all right, nothing excessive. And if you see the same values in the table Time in Zones at the activity on August 10, then I do not know the reason for the difference of coloring between the first two screenshots of your OP, because they both show about the same values. Do you see the same coloring also in Garmin Connect Web?
Which version of Garmin Connect app do you use, and which OS? Did not the coloring change with a recent app update, or do you see these variations also at earlier activities? Which watch model? Do you use an external HRM too?
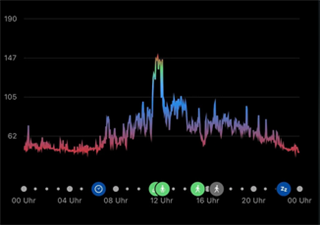
This is interesting. I would've guessed that Garmin is doing A/B testing between different kinds of graph colouring: colour-coded by HR zone, solid red, and shades of red. But it doesn't make sense that you apparently [*] see different styles for different days (I'm also assuming it never changes for a given day?) and the 2nd / middle pic in the OP def doesn't make sense (a combo of reddish and colour-coded by zone).
It is nice that Garmin has changed the activity HR chart to be colour-coded by zone.
Actually, after updating Connect on iOS, both my daily HR and activity HR are colour-coded, but sometimes I see a reddish tint for low values on a graph that also has colour-coding by zones, just like your middle pic. On previous version, I think I just saw solid red for both. (I don't update regularly, as I have auto updated disabled for my apps.)
I don't think it means "too low HR", as that doesn't fit my graphs or yours. (Sometimes I'll see gray for a given very low HR, sometimes I'll see a reddish tint.)
I've also seen a graph where low HR (like 48) is tinted red, slightly higher HR (like 60) is grey, but even higher HR (like 120) is tinted red again. 120 is nowhere near my zone 4 (orange), which starts around 166, or zone 5 (red), which is obviously even higher.
Kind of a head scratcher. It's so Garmin-ish to use colours to mean 2 different things on the same graph (but apparently [*] not all the time):
- zone colours (straightforward), which includes red (zone 5)
- red tint = ??? (something other than zones)
Idk, to me it seems obvious that red (and colour in general) shouldn't be used to mean 2 different things on the same graph.
[*] Yeah, I can imagine that there might be a consistent explanation for the reddish tint after all, but nobody can figure it out and it wouldn't change the fact that red is also used for zone 5 on the same graphs...
Other people are seeing something similar (weird red tint that can't really be explained):
Did not the coloring change with a recent app update, or do you see these variations also at earlier activities?
For me, the changes (colour-coded zones / reddish tint) are retroactive to all-day hr and activities for days long before I updated (which was today) and presumably before the update was rolled out (since nobody has been talking about it until recently). e.g. I can see colour-coded zones for activities from years ago, and I see the reddish tint for some days of all-day HR from 4 months ago. If I go back further for all-day HR, like 5 months to 1 year ago, Garmin tells me that my data has been offloaded and gives me the change to refresh it. After I do this, I still see the same colour-coded zones and (occasional) unexplained reddish tint for lower HR values.
The reddish tint has nothing to do with external HR, as sometimes it's visible when I'm sleeping.
To be clear:
- I see the colour coded zones for both activities and all-day HR, regardless of when the data was recorded (yesterday or years ago)
- I see the reddish tint for some all-day HR data, regardless of when it was recorded. Even some old data that was offloaded (which mean it's about 6 months old or older) has the tint. I can randomly go back a couple of years and see the tint
As another data point, I've scrolled through every day back to May this year and don't get the reddish tint. The line remains the usual blue colour until it rises through the other shades as my HR increases.