Viewing progress in total volume for weightliftning for each exercise over time

I would like to view my progress for weightliftning with a view for each exercise without connect grouping the data. i need the total volume of each exercise over time to see if my total volume in each exercise / muscle group is getting better. The data is useless when it show the total volume per month. I need it per training. 

please granulate data a lot more and add this feature. I was hoping to get the option with connect+ but cant seem to make that work. Anyone succeeded with this?

  • The data is useless when it show the total volume per month. I need it per training. 

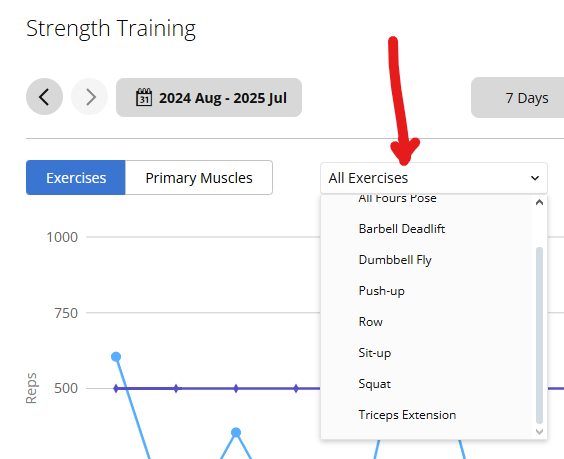
    It is available in Reports (https://connect.garmin.com/modern/report/-2/strength_training/last_twelve_weeks)

    Only the "1 Year" report shows the data per month. The other reports show reps and volume per day.

  • Correct. Maybe I was unclear. I would like the same view option for a year and preferably an All Time view as well. 

  • On a related note, the UX for the strength report view on the Connect website is so bad.

    - the report shows two graphs on the same chart - volume and reps - but to see the individual values, you have to roll over the graphs with your mouse to see an overlay (which only ever shows a value from one graph at a time)

    - as you horizontally roll over the graphs, the overlay annoyingly bounces between volume and reps 

    - to control whether you see volume or reps, you also have to move your mouse vertically, to follow the corresponding graph, or move your mouse slightly to the left or right when it's near a given point (as the volume and reps are not perfectly horizontally aligned, seemingly to avoid the possibility of 2 points from different graphs occupying the exact same space). This can be very annoying when points on the volume and weight graph are vertically close together. The fact that the two charts are purposely not horizontally aligned kinda demonstrates that they realize there's a problem here 

    - the individual activities are listed below the graph, but without volume or reps

    There's a couple of simple things Garmin could've changed to improve this, like:

    - showing both volume and reps in a single overlay, when you roll your mouse over the chart

    - showing volume and reps in the activity list, as well

    In fact, the Connect app does this stuff a bit better:

    - the chart only shows one graph at a time: your choice of volume, reps or sets

    - the activity list below the chart also shows the data from the graph

    Sometimes I wonder if Garmin ever uses their own stuff...

  • I actually like the graphs and the option to toggle them on off by clicking the label below the chart. That helps a lot with the overall activity view as well so you can hide the activitities you dont use

  • That's fair but the UX is bad when both graphs are displayed at the same time (which is the default mode). I can see that it's a bit better if you choose to only display one graph at a time. Either way it sucks that the graph metrics (volume and reps) aren't displayed in the activities list, especially when they are in the Connect app (demonstrating that Garmin sees the value in doing so).

    Overall I don't think Garmin cares about usability as I could point to a million things to can be improved, including things that are unambiguously bad (like displaying the activity gear list in a random, ever-changing order in the Connect app).

    And it's pointless to give feedback to Garmin because it's ignored.