Discrepancy in HR data between daily and 4-week chart

Hello, 

I noticed there are numerous discrepancies between HR data shown on daily charts vs 4-week charts. Examples below. What is correct? How can I trust what is see in Garmin Connect?

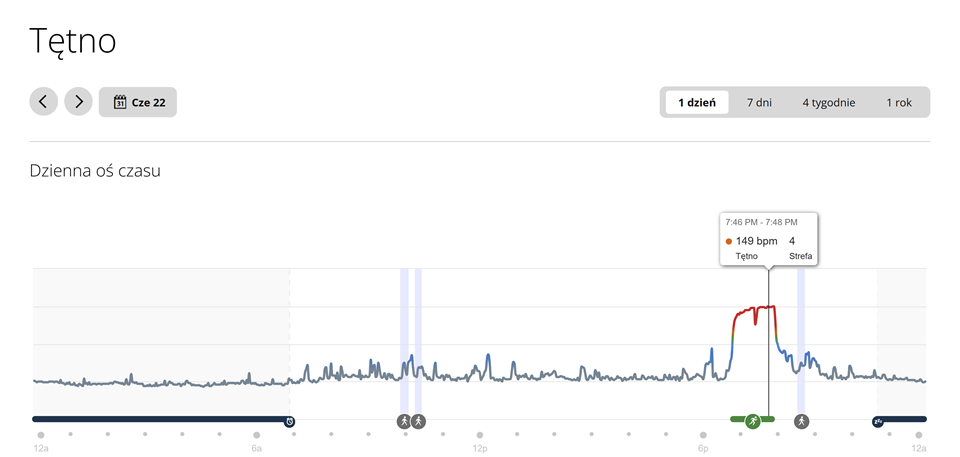
  • The all-day graph shows 2-minutes averages, hence any short peaks are smoothed out.

  • Thanks, how about the daily highs in the 4-week chart. Do you know how they are calculated? Should not these be "smoothed out" even more?

  • Thanks, how about the daily highs in the 4-week chart.

    If you wan to see the Max HR as in activities, then there is the Max Heart Rate report (on the Reports page, not on the HR page!) with the options 7d, 4w, 6m, and 1y. The Max HR value is a quite than the Daily High HR. Not at all the same metrics.

  • Thanks again. I know my max HR as I had it lab tested. My concerns are around weird looking daily highs (shown on the top 4-week chart above) that I cannot reconcile with my exercise recorded metrics. I believe they are wrong and I do suspect these 200+ bpm readings shown as daily highs come from my HRM Pro. 

  • Though, I am not perfectly sure what actually the Max HR report shows. It does not seem to really be the same Max HR estimate as used in the auto-detection of Max HR.

    Well, I checked my data, and the Max HR report does not show the values of the High HR from the daily report. It rather takes the Max HR values from individual activities done on given day (or period). In the case, there are multiple activities, it takes the highest value. This Max HR value is indeed not the same one as the Max HR used in HR Zones, or as the auto-detected Max HR. Therefor, in this case, the use of the term Max HR is a bit confusing.

  • It all makes sense. Yet my issue remains. The daily Max HR readings cannot be reconciled with the data recorded during exercises or any spikes on the daily chart (understanding these are 2 min avgs).

  • The Max HR in activities, and in the Reports are not 2 min averages. There is no Daily Max HR, there is only the Daily High HR, and that's indeed the highest 2 min average. And those two metrics should not be compared, since they each represent something else.

  • Thank you for all the inputs so far, this is super useful. I will have to investigate this more. I found other threads reporting exact same issue and it was linked to the HRM Plus strap recording some artefacts after being taken off the chest. 

  • Once again: there are two (actually three) different high/max HR metrics, and you should not confuse one with the other.

    1. High HR - this is shown on the 1d, 7d, 4w, and 1y tabs of the Heart Rate page (i.e. https://connect.garmin.com/modern/heart-rate/2025-07-09/2)

    2. Max HR - the maximal HR recorded during an activity. It is shown in the stats of each individual activity, and the highest value from all activities in given day is then plotted also on the Max HR 1d, 4w, 6m, 1y reports (i.e. https://connect.garmin.com/modern/report/13/all/last_four_weeks)

    3. (Max HR in User Profile settings - either the default value (age based), or manually entered, or auto-detected. This one is actually unrelated to the two cases above, and the algorithm for the auto-detection differs from the activity Max HR).

    The High HR is based on 2 minute averages (the sampling rate of the all-day HR recording). Typically it will be therefor lower than the Max HR from most activities, which is sampled much more frequently (up to 1s).

    Both metrics are independent, and have little relation to each other. I do not see any inconsistency on my end, and I do not think there is any issue that you need to investigate. It is perfectly normal that the High HR values on the Heart Rate page are lower than Max HR values in activities, or on the Max HR Report.

  • That's the point! Mine are higher - absurdly higher, so it is the opposite of the scenario described in your last sentence. Thanks!