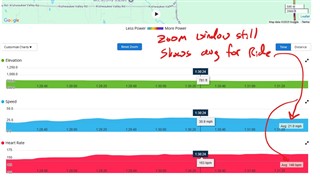
How to see the average of the selection? The zoom window still shows the average values for the entire ride.
How to see the average of the selection? The zoom window still shows the average values for the entire ride.
It would be nice to see this implemented.
Not exactly what you're looking for but:
- the free site runalyze.com allows you to highlight part of a graph and see the average value (as…
Idk, I can only suggest using strava or runalyze. I know it sucks having to use another service (especially when the data isn't *identical* to Connect since a few things are calculated instead of being…
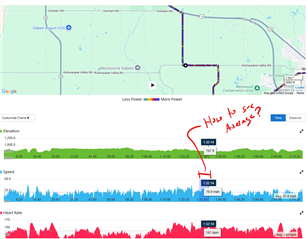
How to see the average of the selection?
You can use the Trim function (click the cogwheel icon to see it). The Trim is fully reversible, and you do not even need to save it, and you can…