Please, return the lost ability to see the full weight history, not only for the latest 12 months. It's easy for you to implement and extremely helpful for us. I found a lot of requests for this feature.
Could you see that before? There are no charts in Garmin Connect that show all data every logged.
Showing a full chart is not easy since the number of years are very different between users. I've got data from over 15 years and some users just a few years. Using the same chart will not work. It must be dynamic and use a user dependent x axis for it to be useful.
I agree that this would be a great feature.
Regarding Garmin's CSV weight export, it has a ton of issues which make it unsuitable for graphing (without editing the data):
- you can only export 1 year at a time [this is actually the least of its problems]
- data is grouped by date, and the row for each individual weigh-in only has the time of day, which makes it harder to graph in excel or google sheets [if you have different numbers of weigh-ins per day, the x-axis won't be uniform with regards to time]
- the units (e.g. "kg") for weight data are in the cells themselves [instead of the headers], which makes it harder to graph [you have to edit the data to remove the units]
- weight is only available in kg [meaning if you want to see weight in lb, you'll have to transform the data yourself]
With all of that in mind, I made a script which can export your historical weight data so you can graph it yourself (in Google Sheets, Excel, Numbers, etc):
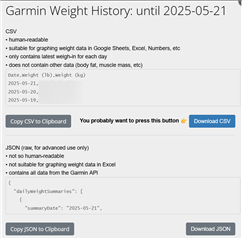
- Exports the latest weigh-in for each day
- Weight is exported in both kg and lb
- All dates are exported [from the beginning to today]
- Exports user-friendly CSV for graphing
- Exports raw JSON [containing all the original data from the Garmin API]
Limitations:
- For the csv file:
-- weigh-ins other than the latest for each day are not exported
-- other data is not exported [e.g. body fat, bone mass, etc.]
The raw JSON export contains *all* the data, but it's not easily graphable or usable for the end user. It would be good for archiving your data, although you'd have to do additional work to get it in a format that's useful for graphing or importing to other services.
I just wanted to make a script that's as simple as possible for the purpose of graphing your weight.
Installation [this is easiest on a computer but also works on mobile]
1) Open your favourite browser (e.g. Chrome, Firefox or Safari)
2) Open the script:
[https://pastebin.com/raw/jtHfJ4vX]
3) Select all the text (CTRL-A on Windows / CMD-A on Mac). Copy the text to the clipboard (CTRL-C / CMD-C)
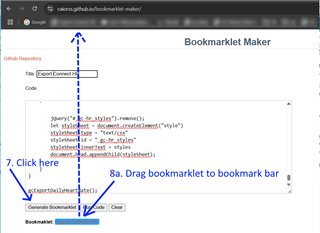
4) Open https://caiorss.github.io/bookmarklet-maker/
5) Click on the Code text box and delete the existing contents. Press CTRL-V / CMD-V to paste the script into the Code text box
6) Set the Title to "Export Connect Weight" (or whatever you want).
7) Click the Generate Bookmarklet button. This will create a blue bookmarklet entitled "Export Connect HR", just below the button you clicked
8a) If you are on a computer:
Show the bookmark bar on your browser (CTRL-SHIFT-B / CMD-SHIFT-B). Drag the blue bookmarklet on to the bookmark bar

8b) If you are on mobile:
Select all the text in the Output box and tap Copy. Bookmark any site at all. Edit the bookmark, and paste the copied text into the URL field
Usage
9) Log into the Garmin Connect website: https://connect.garmin.com/
10) Click the "Export Connect Weight" bookmark.
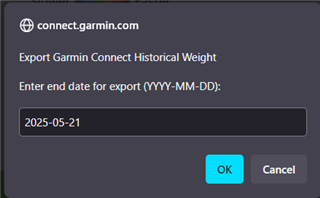
11) You will be asked for the end date of the export (the default is today)

12) Click OK and a modal will pop up with your weight data

13) Click on the Download CSV Button
14) Open the CSV in Excel (or Numbers, Google sheets, etc)
15) Select the columns to graph.
e.g. for weight in lb, select columns A (Date) and B (weight in lb)
e.g. for weight in kg, select columns A (Date) and C (weight in kg)
16)
- In Excel, select Insert > Recommended Charts > Line
- In Google Sheets, select Insert > Chart
Showing a full chart is not easy since the number of years are very different between users.
I doubt this is the hardest thing in the world since Withings Health, MyFitnessPal, runalyze, Excel, Google Sheets and Numbers are all capable of this (to name a few).
It shouldn't even be hard for Garmin since apparently they used to do it.