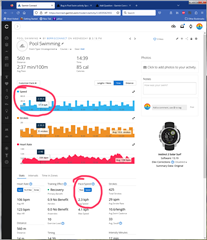
When the Pace/Speed option in the Stats section is changed from Pace to Speed, the first graph changes from displaying Pace to displaying Speed. The vertical axis of graph then indicates the speed, with the time indicated in the horizontal axis. Hovering the mouse cursor over the graph at any location indicates the speed at that particular time. But there are two problems that I see with the indicated speeds.
Problem 1: The indicated speeds, both on the horizontal axis and the with the call out above the mouse cursor are 10 times too high. For example, if my actual speed ranges from 3 kph to 5 kph, the graph shows the speed on the vertical axis as varying between 30 kph and 50 kph, and the mouse cursor call out will show speeds ranging from 30 kph to 50 kph.
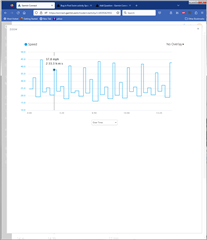
Problem 2: If I click on the graph's expand icon, the zoomed graph will still show the speed value on the vertical axis 10 times too high, and in addition, the mouse cursor call out will now not only show the same incorrect numerical value (10 times too high) as the un-zoomed graph, but now the units are also shown incorrectly as mph instead of kph.