Posting a few features that would be very appreciated on the GC web interface.
-when creating a course, popularity heatmap needs to be visible with higher granularity, without zooming in completely. Why? When creating a longer course, it’s difficult to find best path without almost full zoom, so you end up only seeing roads, instead of the smaller trails that you are often after. But if you zoom in, you don’t see where you are heading, and if the smaller trails will eventually lead you in the right direction.
-Bulk-download all historic activity data in one go. Currently downloading all historic data is very tedious as you have to extend the list of activities manually until all can be selected. Why? allow users to work with own visualization and analysis of their activity data, outside Garmin interfaces.
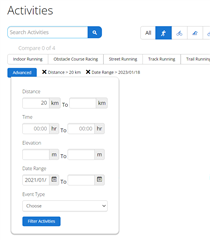
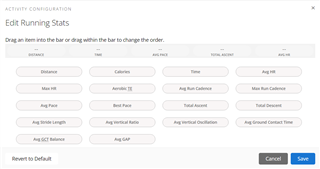
-Better analysis tools on the Webb for your activities. Filter and pivot activities dynamically. E.g. show all runs above 20k and show key data such as average pace, elevation, distance and HR, per month for the past three years. Why? To allow more dynamic analysis of how your performance is developing, for e.g. long runs, marathons, intervals etc etc.