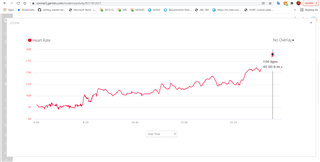
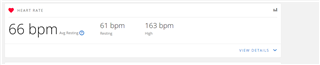
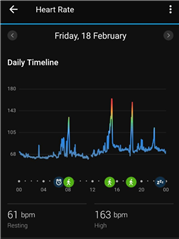
The BPM in the activity chart is much greater than other figures. For example, in the examples below my max BPM is 190 (very dangerous for a man of my age) whilst the other figures from the app for the same day show a max of 166bpm. 166 matches the BPM graph (not activity graph) from the Android phone app.
Am I misinterpreting or is the activity chart really wrong?
Thanks