This discussion has been locked.
You can no longer post new replies to this discussion. If you have a question you can start a new discussion

Health and wellnes data in excel format (PERSONAL STATISTICS)

hi, I have a vivosmart 4 and I would like, for personal statistics, to get all the health and wellness data in an excel format (stress, steps, heart rate, sleep, vo2max and floors up / down) is there a method? i saw i can download them in .fit but i can't find anything to convert it. thank you

  • Open the Reports page and F12 -> Network tab, then click wanted chart.

    It will show downloaded JSON with a link like that:
    /proxy/userstats-service/wellness/daily/USER?fromDate=2020-01-01&untilDate=2021-01-01&metricId=29

    You can Edit request, change date or add metricId and Re-send, then check Response.
    This way you can get raw data of chosen statistics.

  • Thank you, I can't find anything, would you be kind enough to show me a video guide, or send me some screenshots? [email protected]

  • Better not to make e-mail addresses public as those are harvested and later you'll get spam.


    About the topic, well, as I wrote above.

    For example:

    1. open Reports -> Health&Fitness -> Steps
    2. press F12 key which opens Developer Tools -> select Network tab -> then click on the chart for 7 days
    3. it will download raw data for the chart and show it below as link
    4. select that link and there will be details, click Response to see raw data
    5. or click Edit to change dates - for example: fromDate=2020-01-01&untilDate=2021-01-01 to get a year of steps, click Re-Send and check Response tab again - it's JSON which you can import

    For video, just search for tutorials about Developer Tools for a web-browser which you use. If you know how to use it, then you can check any website with it.


    And you can also use Export option visible on the website, but it will export only values visible on a chart. If you want all data, then JSON is better.

  • I'm sorry i can't find way out..I go into reports, hit f12, click on network tab, click on 7 days, and see no graphs, no download links..there is a video? or if you can register one on the fly and send it to me as mp to the email I wrote in the message above? it's a secondary email .. thanks a lot

  • After you click on 7 days on the graph - the Network tab will show a new link like this:

    Status Method Domain File Cause Type
    200 GET connect.garmin.com USER?fromDate=2020-01-01&untilDate=2021-01-01&... vendor.js:1 (xhr) json


    Then you can select it and choose Edit & Resend (to change date) or Response (to view it) or Copy -> Copy Response (to copy it to Clipboard). Response is in text which you'll need to import.

    There are tutorials on YouTube how to use the Network tab, just type: Developer Tools Network tab and for sure you'll find many videos with a better explanations. After that, you can search videos for: import JSON Excel.

  • thank you so much

  • Forgive me for jumping in, but I can only get partway through your instructions.

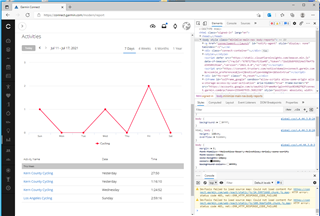
    Open Garmin Express, select my device, Vivo Active,  From the left column find the Reports option and select it.  A display is opened with a data point for each day's activities, and the list of activities below it.

    Press F12 to open the Microsoft Edge DevTools, then click button "Open DevTools".  Never used it before.  

    Instructions are: After you click on 7 days on the graph.

    Lost me there.  The graph has 7 data points, four of which are on the zero line, two on the 1 line and one on the 2 line.  How does one click on the 7 days on the graph?  Clicking on each data point has no effect.

    Here is the screen image:

    What is the next step.

    The goal is to get the data in CSV of something to import into Excel.  Because the charts provided by Garmin Express do not allow the user to customize the graphs and they do not show the data well.

  • The Network tab is hidden under arrows >> or drag Dev Tools from right side to the bottom to make it larger and with all tabs visible. When you switch to Network tab, it will show all loading links, so if you click on 7 days above chart, it will load one JSON file for it. And if some options would be missing, then you can try other browser.