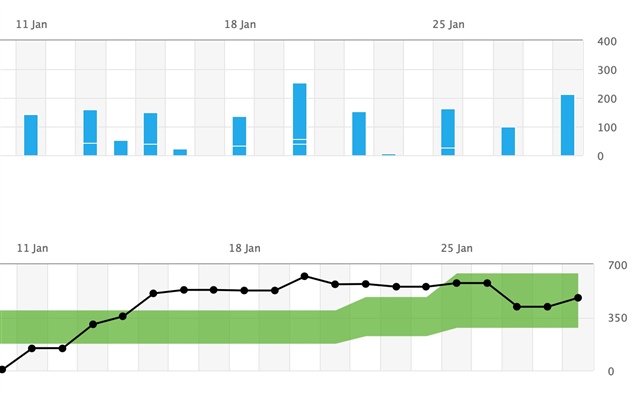
What is the relationship between the Exercise Load (blue) and 7-Day Training Load (green) graphs? I always thought that the current 7-Day graph value is the sum of training load numbers for the last 7 days. Looking back on it like that, it probably isn't. Sometimes the numbers sort of match, but sometimes they don't. I noticed it by accident the day before yesterday. Normally I just check if my "black line" stays inside the green range. The day before yesterday I had a fast run of 4 km and the graph did not change at all. I attributed it to headaches and general nausea, although the training load for the activity showed 99 (Threshold Run with 3.3 Aerobic value). Today, however, after a long time, I ran 10 km with a training load of 212 (Threshold Run, 4.4 Aerobic, 1.0 Anaerobic) and the black line grew only by as little as 60 points. Until Wednesday, I was "Productive" for about 3 weeks, then it changed to "Maintaining". It's hard to say if it affects it.