This discussion has been locked.
You can no longer post new replies to this discussion. If you have a question you can start a new discussion

Is it possible to have a graph of heart rate and overlay elevation and speed?

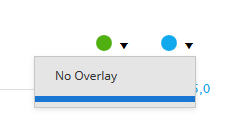
If I start with elevation I can overlay HR but not speed. Likewise with speed HR is an option. Starting with HR neither elevation or speed are available.

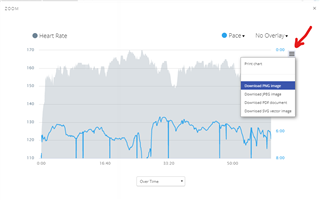
Why no graph title? You have to remember what you started with or the colour coding. Why no save or download? Screen shots are a poor solution to saving this.

  • You can - for bike start with Heart Rate and add Elevation and Speed - it's there, just without labels:

    Other graphs also have two options, just one option has label and another hasn't, but it's there.

    .

    Garmin use the HighCharts which are customizable, all features you mentioned are available (you can check demo on vendor website), garmin only needs to turn them on.

    But, well, you see garmin is too lazy even to properly enter labels, so we're out of luck, for sure they won't turn on those features any time soon.

  • Thanks for the reply but I can't see any drop down arrows next to the coloured dots. I'm in the detail of an activity and I expand the chart to get to this.

    No drop down by the red dot. Elevation and Speed are not options for an overlay.

    But the chart title has now appeared.

  • Point your mouse, in the dropdown menu, over the empty space between "No Overlay" and "Bike Cadence", and when it changes color, click. It will activate the overlay of the missing label.

  • Ah ha! I see. There are two missing categories and they are there between "No Overlay" and "Bike Cadence" two bars or lines that when selected in the drop down make the hidden category appear. What a UI!

    Thank you very much for the help. Much appreciated. I see @BunBun! did explain this but I didn't understand the blue line in their screen grab was what I was supposed to click. Thank you both.

  • Well, since it looks like Garmin's developers are busy, I decided to fix it myself through a local override. I published the fix on GitHub. More details about it are in this thread: https://forums.garmin.com/apps-software/mobile-apps-web/f/garmin-connect-web/214055/introducing-gcoverrides

    Let me know if it works for you. For the moment it is just myself who tested it.

    I will try to add the missing title and to tweak some other details, too, if I find enough time.

  • Why no save or download? Screen shots are a poor solution to saving this.

    I've just added this possibility to the local overrides of Garmin Connect, too. New version of the GCOverrides v1.07 allows now the export / saving of  activtity graphs as images (PNG, JGP, SVG) or PDF. At the full-size zoomed activity graphs, you can click the hamburger symbol on the right side, to get the Export menu as shown on the following screenshot: